Immigrants vs Immigrants from Chile Per Capita Income
COMPARE
Immigrants
Immigrants from Chile
Per Capita Income
Per Capita Income Comparison
Immigrants
Immigrants from Chile
$43,010
PER CAPITA INCOME
32.5/ 100
METRIC RATING
185th/ 347
METRIC RANK
$46,213
PER CAPITA INCOME
94.6/ 100
METRIC RATING
115th/ 347
METRIC RANK
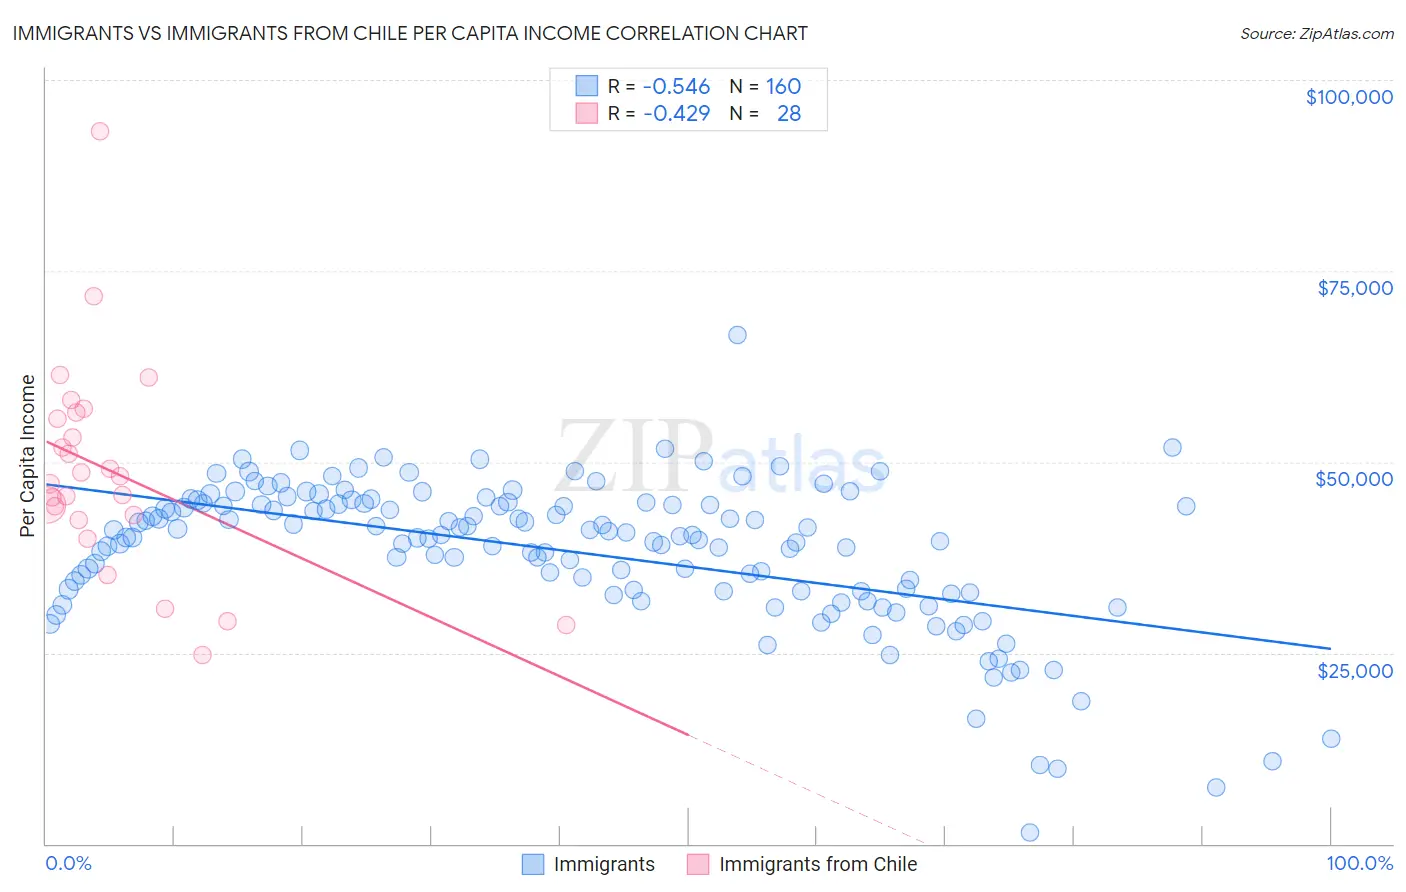
Immigrants vs Immigrants from Chile Per Capita Income Correlation Chart
The statistical analysis conducted on geographies consisting of 577,833,144 people shows a substantial negative correlation between the proportion of Immigrants and per capita income in the United States with a correlation coefficient (R) of -0.546 and weighted average of $43,010. Similarly, the statistical analysis conducted on geographies consisting of 218,646,729 people shows a moderate negative correlation between the proportion of Immigrants from Chile and per capita income in the United States with a correlation coefficient (R) of -0.429 and weighted average of $46,213, a difference of 7.4%.
Per Capita Income Correlation Summary
| Measurement | Immigrants | Immigrants from Chile |
| Minimum | $1,397 | $24,660 |
| Maximum | $66,654 | $93,304 |
| Range | $65,257 | $68,644 |
| Mean | $38,278 | $48,666 |
| Median | $40,300 | $47,656 |
| Interquartile 25% (IQ1) | $33,050 | $42,721 |
| Interquartile 75% (IQ3) | $44,506 | $56,086 |
| Interquartile Range (IQR) | $11,456 | $13,365 |
| Standard Deviation (Sample) | $9,625 | $13,904 |
| Standard Deviation (Population) | $9,595 | $13,654 |
Similar Demographics by Per Capita Income
Demographics Similar to Immigrants by Per Capita Income
In terms of per capita income, the demographic groups most similar to Immigrants are French Canadian ($43,003, a difference of 0.020%), Spaniard ($43,028, a difference of 0.040%), Immigrants from Colombia ($42,971, a difference of 0.090%), German ($43,067, a difference of 0.13%), and Immigrants from Africa ($42,950, a difference of 0.14%).
| Demographics | Rating | Rank | Per Capita Income |
| Immigrants | Costa Rica | 44.5 /100 | #178 | Average $43,464 |
| Finns | 44.4 /100 | #179 | Average $43,461 |
| Sierra Leoneans | 42.9 /100 | #180 | Average $43,405 |
| Welsh | 38.2 /100 | #181 | Fair $43,233 |
| Immigrants | Vietnam | 38.1 /100 | #182 | Fair $43,229 |
| Germans | 33.9 /100 | #183 | Fair $43,067 |
| Spaniards | 32.9 /100 | #184 | Fair $43,028 |
| Immigrants | Immigrants | 32.5 /100 | #185 | Fair $43,010 |
| French Canadians | 32.3 /100 | #186 | Fair $43,003 |
| Immigrants | Colombia | 31.5 /100 | #187 | Fair $42,971 |
| Immigrants | Africa | 31.0 /100 | #188 | Fair $42,950 |
| Bermudans | 30.1 /100 | #189 | Fair $42,911 |
| Kenyans | 27.7 /100 | #190 | Fair $42,808 |
| Yugoslavians | 27.4 /100 | #191 | Fair $42,792 |
| Iraqis | 26.7 /100 | #192 | Fair $42,760 |
Demographics Similar to Immigrants from Chile by Per Capita Income
In terms of per capita income, the demographic groups most similar to Immigrants from Chile are Afghan ($46,268, a difference of 0.12%), Polish ($46,123, a difference of 0.20%), Chinese ($46,098, a difference of 0.25%), Immigrants from Albania ($46,387, a difference of 0.38%), and Immigrants from Saudi Arabia ($46,008, a difference of 0.45%).
| Demographics | Rating | Rank | Per Capita Income |
| Immigrants | Kuwait | 96.2 /100 | #108 | Exceptional $46,543 |
| Immigrants | Northern Africa | 96.2 /100 | #109 | Exceptional $46,531 |
| Chileans | 95.9 /100 | #110 | Exceptional $46,459 |
| Taiwanese | 95.8 /100 | #111 | Exceptional $46,455 |
| Immigrants | Morocco | 95.7 /100 | #112 | Exceptional $46,430 |
| Immigrants | Albania | 95.5 /100 | #113 | Exceptional $46,387 |
| Afghans | 94.9 /100 | #114 | Exceptional $46,268 |
| Immigrants | Chile | 94.6 /100 | #115 | Exceptional $46,213 |
| Poles | 94.1 /100 | #116 | Exceptional $46,123 |
| Chinese | 93.9 /100 | #117 | Exceptional $46,098 |
| Immigrants | Saudi Arabia | 93.3 /100 | #118 | Exceptional $46,008 |
| Immigrants | Poland | 93.1 /100 | #119 | Exceptional $45,979 |
| Immigrants | Ethiopia | 92.7 /100 | #120 | Exceptional $45,923 |
| Canadians | 92.2 /100 | #121 | Exceptional $45,858 |
| Moroccans | 92.1 /100 | #122 | Exceptional $45,854 |