Immigrants vs Immigrants from West Indies Male Disability
COMPARE
Immigrants
Immigrants from West Indies
Male Disability
Male Disability Comparison
Immigrants
Immigrants from West Indies
10.8%
MALE DISABILITY
93.9/ 100
METRIC RATING
110th/ 347
METRIC RANK
11.1%
MALE DISABILITY
65.7/ 100
METRIC RATING
161st/ 347
METRIC RANK
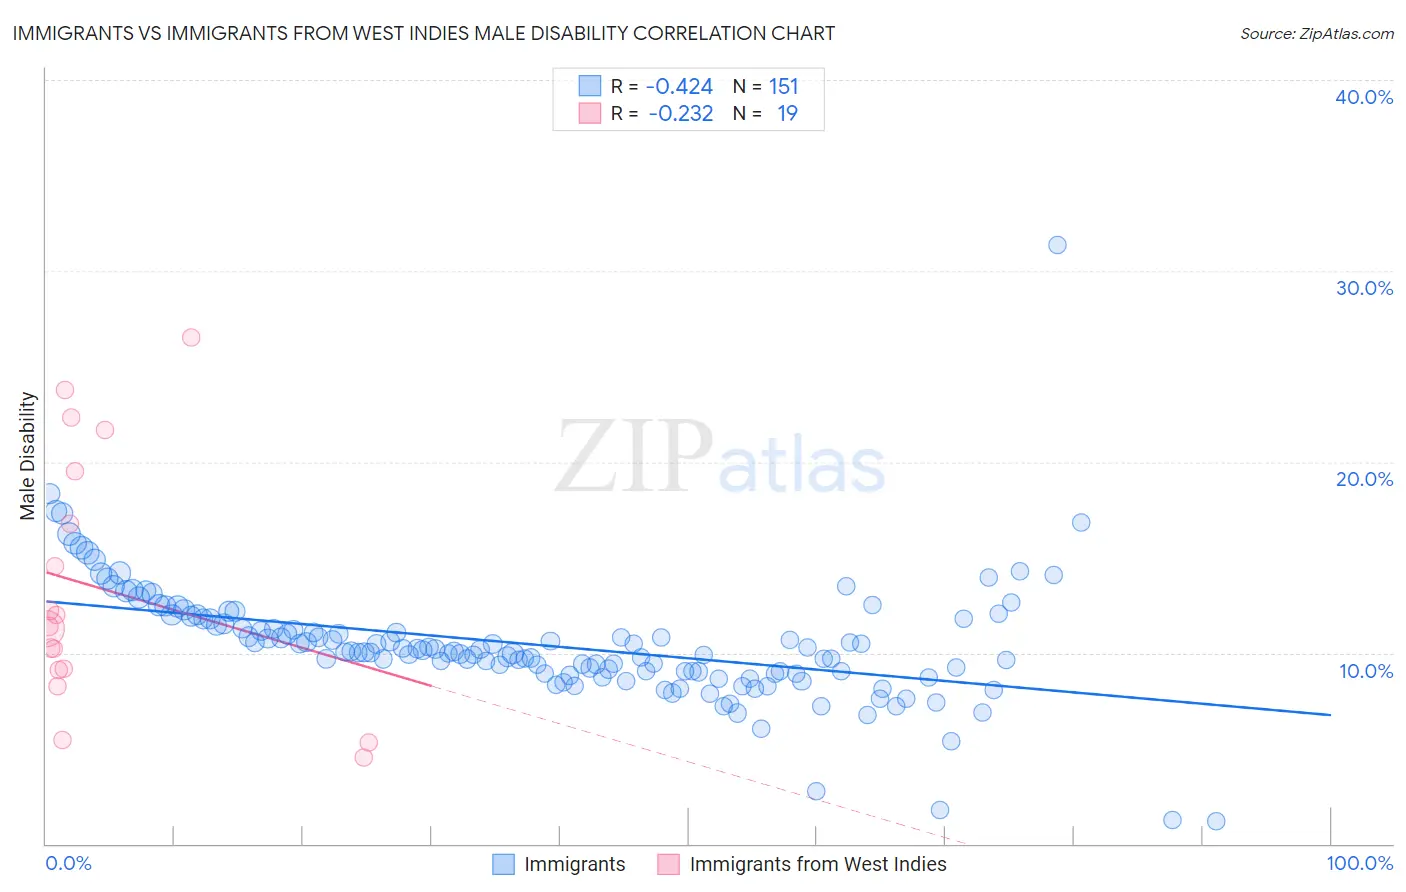
Immigrants vs Immigrants from West Indies Male Disability Correlation Chart
The statistical analysis conducted on geographies consisting of 577,387,777 people shows a moderate negative correlation between the proportion of Immigrants and percentage of males with a disability in the United States with a correlation coefficient (R) of -0.424 and weighted average of 10.8%. Similarly, the statistical analysis conducted on geographies consisting of 72,456,461 people shows a weak negative correlation between the proportion of Immigrants from West Indies and percentage of males with a disability in the United States with a correlation coefficient (R) of -0.232 and weighted average of 11.1%, a difference of 3.0%.
Male Disability Correlation Summary
| Measurement | Immigrants | Immigrants from West Indies |
| Minimum | 1.2% | 4.5% |
| Maximum | 31.4% | 26.5% |
| Range | 30.2% | 22.0% |
| Mean | 10.4% | 13.4% |
| Median | 10.0% | 11.4% |
| Interquartile 25% (IQ1) | 8.9% | 9.1% |
| Interquartile 75% (IQ3) | 11.8% | 19.5% |
| Interquartile Range (IQR) | 2.8% | 10.4% |
| Standard Deviation (Sample) | 3.2% | 6.6% |
| Standard Deviation (Population) | 3.2% | 6.4% |
Similar Demographics by Male Disability
Demographics Similar to Immigrants by Male Disability
In terms of male disability, the demographic groups most similar to Immigrants are Immigrants from Uganda (10.8%, a difference of 0.030%), Immigrants from Uruguay (10.8%, a difference of 0.040%), Immigrants from Belgium (10.8%, a difference of 0.080%), Immigrants from Eastern Africa (10.8%, a difference of 0.090%), and Ghanaian (10.8%, a difference of 0.14%).
| Demographics | Rating | Rank | Male Disability |
| Uruguayans | 95.3 /100 | #103 | Exceptional 10.7% |
| Immigrants | Nigeria | 95.1 /100 | #104 | Exceptional 10.8% |
| Immigrants | Brazil | 95.0 /100 | #105 | Exceptional 10.8% |
| Immigrants | Syria | 94.9 /100 | #106 | Exceptional 10.8% |
| Immigrants | Eastern Africa | 94.3 /100 | #107 | Exceptional 10.8% |
| Immigrants | Belgium | 94.2 /100 | #108 | Exceptional 10.8% |
| Immigrants | Uganda | 94.0 /100 | #109 | Exceptional 10.8% |
| Immigrants | Immigrants | 93.9 /100 | #110 | Exceptional 10.8% |
| Immigrants | Uruguay | 93.8 /100 | #111 | Exceptional 10.8% |
| Ghanaians | 93.4 /100 | #112 | Exceptional 10.8% |
| Immigrants | Zimbabwe | 93.0 /100 | #113 | Exceptional 10.8% |
| Central Americans | 92.7 /100 | #114 | Exceptional 10.8% |
| Immigrants | Barbados | 92.2 /100 | #115 | Exceptional 10.8% |
| Immigrants | South Africa | 91.8 /100 | #116 | Exceptional 10.8% |
| Eastern Europeans | 90.6 /100 | #117 | Exceptional 10.9% |
Demographics Similar to Immigrants from West Indies by Male Disability
In terms of male disability, the demographic groups most similar to Immigrants from West Indies are Immigrants from Haiti (11.1%, a difference of 0.020%), Albanian (11.1%, a difference of 0.050%), Guatemalan (11.1%, a difference of 0.090%), Immigrants from Kenya (11.1%, a difference of 0.12%), and Latvian (11.1%, a difference of 0.16%).
| Demographics | Rating | Rank | Male Disability |
| Immigrants | Moldova | 72.8 /100 | #154 | Good 11.1% |
| Immigrants | Middle Africa | 70.9 /100 | #155 | Good 11.1% |
| Russians | 69.8 /100 | #156 | Good 11.1% |
| Immigrants | Western Africa | 69.2 /100 | #157 | Good 11.1% |
| Latvians | 68.1 /100 | #158 | Good 11.1% |
| Guatemalans | 67.2 /100 | #159 | Good 11.1% |
| Albanians | 66.5 /100 | #160 | Good 11.1% |
| Immigrants | West Indies | 65.7 /100 | #161 | Good 11.1% |
| Immigrants | Haiti | 65.3 /100 | #162 | Good 11.1% |
| Immigrants | Kenya | 63.8 /100 | #163 | Good 11.1% |
| British West Indians | 62.8 /100 | #164 | Good 11.1% |
| Luxembourgers | 61.9 /100 | #165 | Good 11.1% |
| Immigrants | Hungary | 61.2 /100 | #166 | Good 11.1% |
| Immigrants | Southern Europe | 54.4 /100 | #167 | Average 11.2% |
| Immigrants | Latin America | 54.0 /100 | #168 | Average 11.2% |