Immigrants from Zimbabwe vs Immigrants from Netherlands Married-couple Households
COMPARE
Immigrants from Zimbabwe
Immigrants from Netherlands
Married-couple Households
Married-couple Households Comparison
Immigrants from Zimbabwe
Immigrants from Netherlands
46.3%
MARRIED-COUPLE HOUSEHOLDS
43.0/ 100
METRIC RATING
179th/ 347
METRIC RANK
48.2%
MARRIED-COUPLE HOUSEHOLDS
98.2/ 100
METRIC RATING
79th/ 347
METRIC RANK
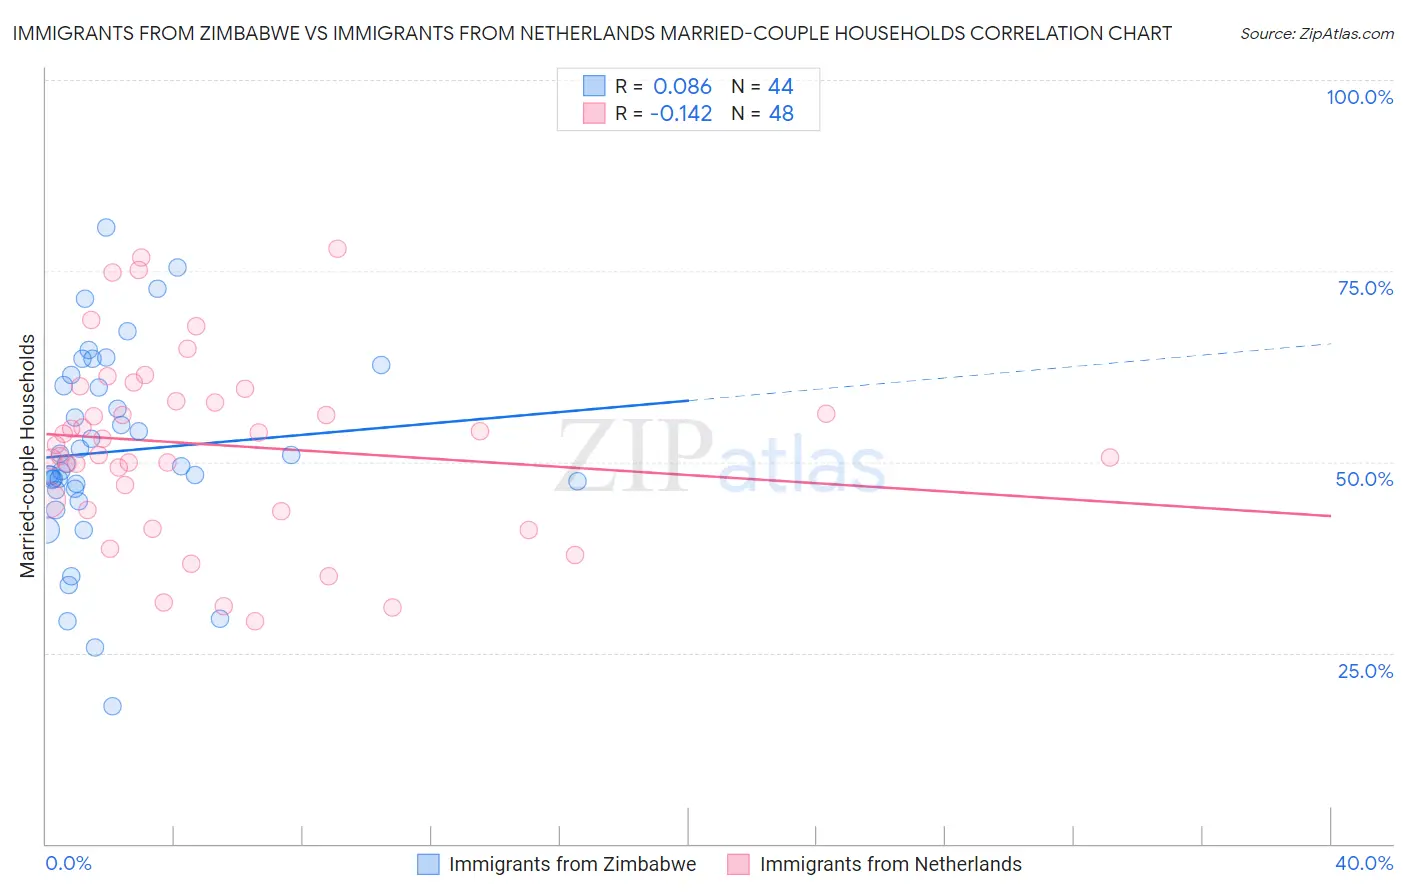
Immigrants from Zimbabwe vs Immigrants from Netherlands Married-couple Households Correlation Chart
The statistical analysis conducted on geographies consisting of 117,791,116 people shows a slight positive correlation between the proportion of Immigrants from Zimbabwe and percentage of married-couple family households in the United States with a correlation coefficient (R) of 0.086 and weighted average of 46.3%. Similarly, the statistical analysis conducted on geographies consisting of 237,797,342 people shows a poor negative correlation between the proportion of Immigrants from Netherlands and percentage of married-couple family households in the United States with a correlation coefficient (R) of -0.142 and weighted average of 48.2%, a difference of 4.0%.
Married-couple Households Correlation Summary
| Measurement | Immigrants from Zimbabwe | Immigrants from Netherlands |
| Minimum | 17.9% | 29.2% |
| Maximum | 80.8% | 77.9% |
| Range | 62.8% | 48.7% |
| Mean | 51.4% | 52.3% |
| Median | 49.6% | 52.7% |
| Interquartile 25% (IQ1) | 46.4% | 44.4% |
| Interquartile 75% (IQ3) | 60.6% | 58.8% |
| Interquartile Range (IQR) | 14.2% | 14.4% |
| Standard Deviation (Sample) | 13.1% | 12.0% |
| Standard Deviation (Population) | 13.0% | 11.9% |
Similar Demographics by Married-couple Households
Demographics Similar to Immigrants from Zimbabwe by Married-couple Households
In terms of married-couple households, the demographic groups most similar to Immigrants from Zimbabwe are Immigrants from Costa Rica (46.3%, a difference of 0.010%), Immigrants (46.3%, a difference of 0.030%), Mongolian (46.3%, a difference of 0.040%), Malaysian (46.3%, a difference of 0.050%), and Cajun (46.4%, a difference of 0.090%).
| Demographics | Rating | Rank | Married-couple Households |
| Immigrants | Australia | 54.6 /100 | #172 | Average 46.5% |
| Immigrants | Norway | 52.0 /100 | #173 | Average 46.5% |
| Immigrants | Mexico | 50.0 /100 | #174 | Average 46.4% |
| Immigrants | Colombia | 46.1 /100 | #175 | Average 46.4% |
| Cajuns | 45.2 /100 | #176 | Average 46.4% |
| Immigrants | Immigrants | 43.8 /100 | #177 | Average 46.3% |
| Immigrants | Costa Rica | 43.4 /100 | #178 | Average 46.3% |
| Immigrants | Zimbabwe | 43.0 /100 | #179 | Average 46.3% |
| Mongolians | 42.0 /100 | #180 | Average 46.3% |
| Malaysians | 41.8 /100 | #181 | Average 46.3% |
| Yugoslavians | 38.9 /100 | #182 | Fair 46.2% |
| Immigrants | Brazil | 38.3 /100 | #183 | Fair 46.2% |
| Immigrants | Switzerland | 36.9 /100 | #184 | Fair 46.2% |
| Brazilians | 35.9 /100 | #185 | Fair 46.2% |
| Albanians | 31.1 /100 | #186 | Fair 46.1% |
Demographics Similar to Immigrants from Netherlands by Married-couple Households
In terms of married-couple households, the demographic groups most similar to Immigrants from Netherlands are Egyptian (48.2%, a difference of 0.010%), Russian (48.2%, a difference of 0.020%), Canadian (48.2%, a difference of 0.030%), Finnish (48.1%, a difference of 0.090%), and Immigrants from Fiji (48.2%, a difference of 0.12%).
| Demographics | Rating | Rank | Married-couple Households |
| Scotch-Irish | 98.6 /100 | #72 | Exceptional 48.3% |
| Immigrants | Singapore | 98.6 /100 | #73 | Exceptional 48.3% |
| Immigrants | Romania | 98.6 /100 | #74 | Exceptional 48.3% |
| Immigrants | England | 98.4 /100 | #75 | Exceptional 48.2% |
| Immigrants | Fiji | 98.4 /100 | #76 | Exceptional 48.2% |
| Canadians | 98.2 /100 | #77 | Exceptional 48.2% |
| Egyptians | 98.2 /100 | #78 | Exceptional 48.2% |
| Immigrants | Netherlands | 98.2 /100 | #79 | Exceptional 48.2% |
| Russians | 98.1 /100 | #80 | Exceptional 48.2% |
| Finns | 98.0 /100 | #81 | Exceptional 48.1% |
| Immigrants | Poland | 97.7 /100 | #82 | Exceptional 48.1% |
| Guamanians/Chamorros | 97.6 /100 | #83 | Exceptional 48.1% |
| Ukrainians | 97.6 /100 | #84 | Exceptional 48.1% |
| Immigrants | Israel | 97.4 /100 | #85 | Exceptional 48.0% |
| Belgians | 97.4 /100 | #86 | Exceptional 48.0% |