Immigrants from Zimbabwe vs Portuguese Vision Disability
COMPARE
Immigrants from Zimbabwe
Portuguese
Vision Disability
Vision Disability Comparison
Immigrants from Zimbabwe
Portuguese
2.1%
VISION DISABILITY
91.0/ 100
METRIC RATING
120th/ 347
METRIC RANK
2.3%
VISION DISABILITY
4.9/ 100
METRIC RATING
218th/ 347
METRIC RANK
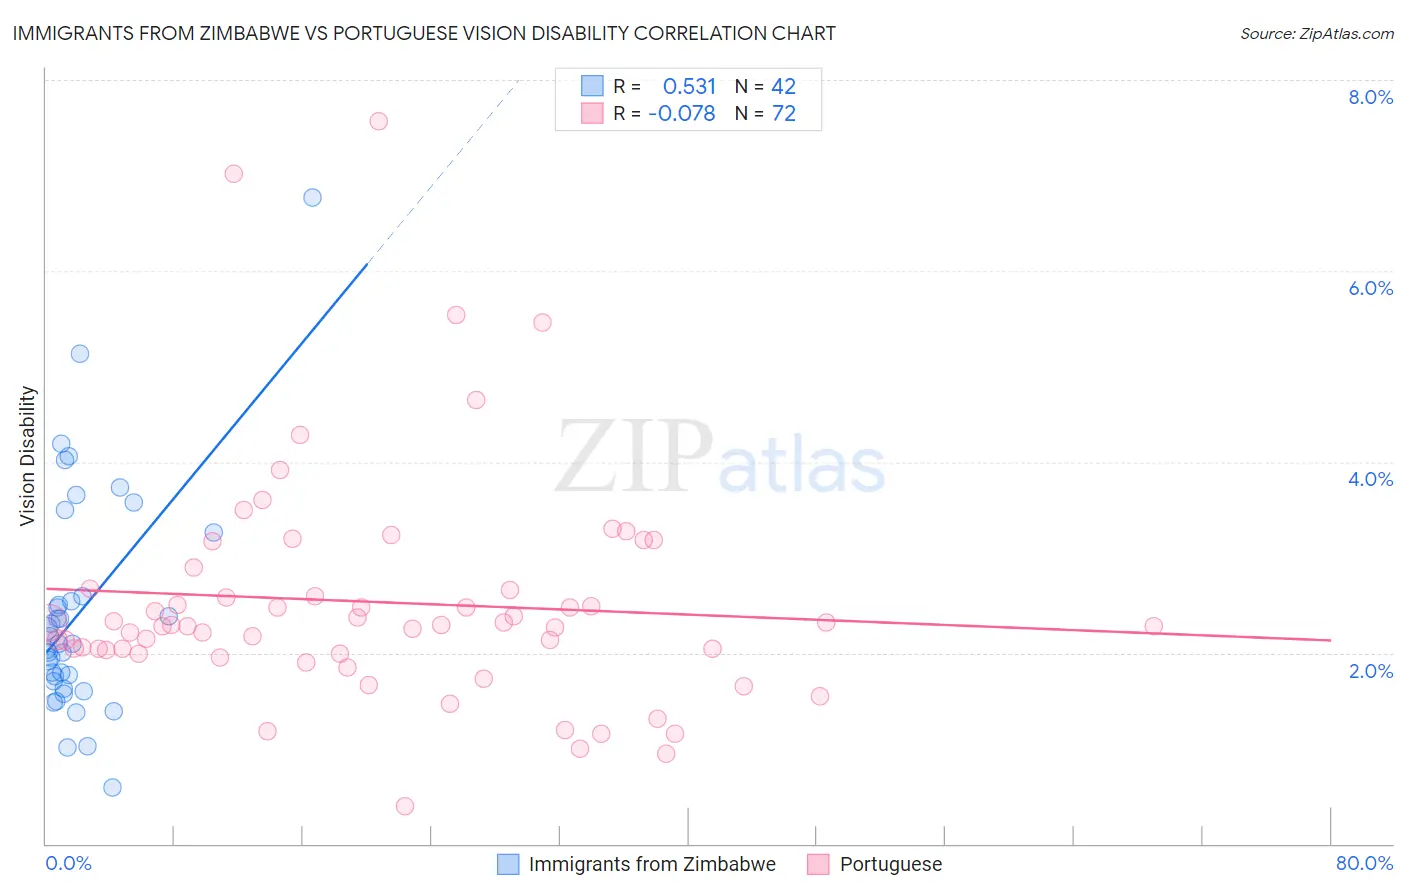
Immigrants from Zimbabwe vs Portuguese Vision Disability Correlation Chart
The statistical analysis conducted on geographies consisting of 117,800,208 people shows a substantial positive correlation between the proportion of Immigrants from Zimbabwe and percentage of population with vision disability in the United States with a correlation coefficient (R) of 0.531 and weighted average of 2.1%. Similarly, the statistical analysis conducted on geographies consisting of 449,734,569 people shows a slight negative correlation between the proportion of Portuguese and percentage of population with vision disability in the United States with a correlation coefficient (R) of -0.078 and weighted average of 2.3%, a difference of 8.6%.
Vision Disability Correlation Summary
| Measurement | Immigrants from Zimbabwe | Portuguese |
| Minimum | 0.59% | 0.39% |
| Maximum | 6.8% | 7.6% |
| Range | 6.2% | 7.2% |
| Mean | 2.4% | 2.5% |
| Median | 2.1% | 2.3% |
| Interquartile 25% (IQ1) | 1.7% | 2.0% |
| Interquartile 75% (IQ3) | 2.6% | 2.7% |
| Interquartile Range (IQR) | 0.89% | 0.65% |
| Standard Deviation (Sample) | 1.2% | 1.2% |
| Standard Deviation (Population) | 1.2% | 1.2% |
Similar Demographics by Vision Disability
Demographics Similar to Immigrants from Zimbabwe by Vision Disability
In terms of vision disability, the demographic groups most similar to Immigrants from Zimbabwe are Immigrants from Uganda (2.1%, a difference of 0.060%), Immigrants from Philippines (2.1%, a difference of 0.070%), Immigrants from Scotland (2.1%, a difference of 0.12%), Immigrants from Ukraine (2.1%, a difference of 0.13%), and Immigrants from Albania (2.1%, a difference of 0.13%).
| Demographics | Rating | Rank | Vision Disability |
| Kenyans | 92.5 /100 | #113 | Exceptional 2.1% |
| Croatians | 92.3 /100 | #114 | Exceptional 2.1% |
| Immigrants | Vietnam | 92.2 /100 | #115 | Exceptional 2.1% |
| Ugandans | 92.2 /100 | #116 | Exceptional 2.1% |
| Poles | 92.0 /100 | #117 | Exceptional 2.1% |
| Immigrants | Philippines | 91.4 /100 | #118 | Exceptional 2.1% |
| Immigrants | Uganda | 91.4 /100 | #119 | Exceptional 2.1% |
| Immigrants | Zimbabwe | 91.0 /100 | #120 | Exceptional 2.1% |
| Immigrants | Scotland | 90.4 /100 | #121 | Exceptional 2.1% |
| Immigrants | Ukraine | 90.4 /100 | #122 | Exceptional 2.1% |
| Immigrants | Albania | 90.4 /100 | #123 | Exceptional 2.1% |
| Immigrants | Spain | 89.8 /100 | #124 | Excellent 2.1% |
| Immigrants | Venezuela | 89.8 /100 | #125 | Excellent 2.1% |
| Immigrants | Peru | 89.5 /100 | #126 | Excellent 2.1% |
| Sudanese | 89.2 /100 | #127 | Excellent 2.1% |
Demographics Similar to Portuguese by Vision Disability
In terms of vision disability, the demographic groups most similar to Portuguese are Barbadian (2.3%, a difference of 0.070%), Ecuadorian (2.3%, a difference of 0.11%), Immigrants from Trinidad and Tobago (2.3%, a difference of 0.34%), Guamanian/Chamorro (2.3%, a difference of 0.35%), and French Canadian (2.3%, a difference of 0.36%).
| Demographics | Rating | Rank | Vision Disability |
| Indonesians | 9.5 /100 | #211 | Tragic 2.2% |
| Bermudans | 9.0 /100 | #212 | Tragic 2.2% |
| Immigrants | Ghana | 8.9 /100 | #213 | Tragic 2.2% |
| Trinidadians and Tobagonians | 8.2 /100 | #214 | Tragic 2.2% |
| Nigerians | 7.2 /100 | #215 | Tragic 2.3% |
| Immigrants | Trinidad and Tobago | 6.1 /100 | #216 | Tragic 2.3% |
| Barbadians | 5.1 /100 | #217 | Tragic 2.3% |
| Portuguese | 4.9 /100 | #218 | Tragic 2.3% |
| Ecuadorians | 4.6 /100 | #219 | Tragic 2.3% |
| Guamanians/Chamorros | 3.9 /100 | #220 | Tragic 2.3% |
| French Canadians | 3.9 /100 | #221 | Tragic 2.3% |
| Immigrants | Senegal | 3.8 /100 | #222 | Tragic 2.3% |
| Basques | 3.5 /100 | #223 | Tragic 2.3% |
| Irish | 3.4 /100 | #224 | Tragic 2.3% |
| Immigrants | Western Africa | 3.4 /100 | #225 | Tragic 2.3% |