Immigrants from Zimbabwe vs Immigrants from the Azores Unemployment Among Ages 60 to 64 years
COMPARE
Immigrants from Zimbabwe
Immigrants from the Azores
Unemployment Among Ages 60 to 64 years
Unemployment Among Ages 60 to 64 years Comparison
Immigrants from Zimbabwe
Immigrants from the Azores
4.6%
UNEMPLOYMENT AMONG AGES 60 TO 64 YEARS
99.9/ 100
METRIC RATING
48th/ 347
METRIC RANK
4.0%
UNEMPLOYMENT AMONG AGES 60 TO 64 YEARS
100.0/ 100
METRIC RATING
5th/ 347
METRIC RANK
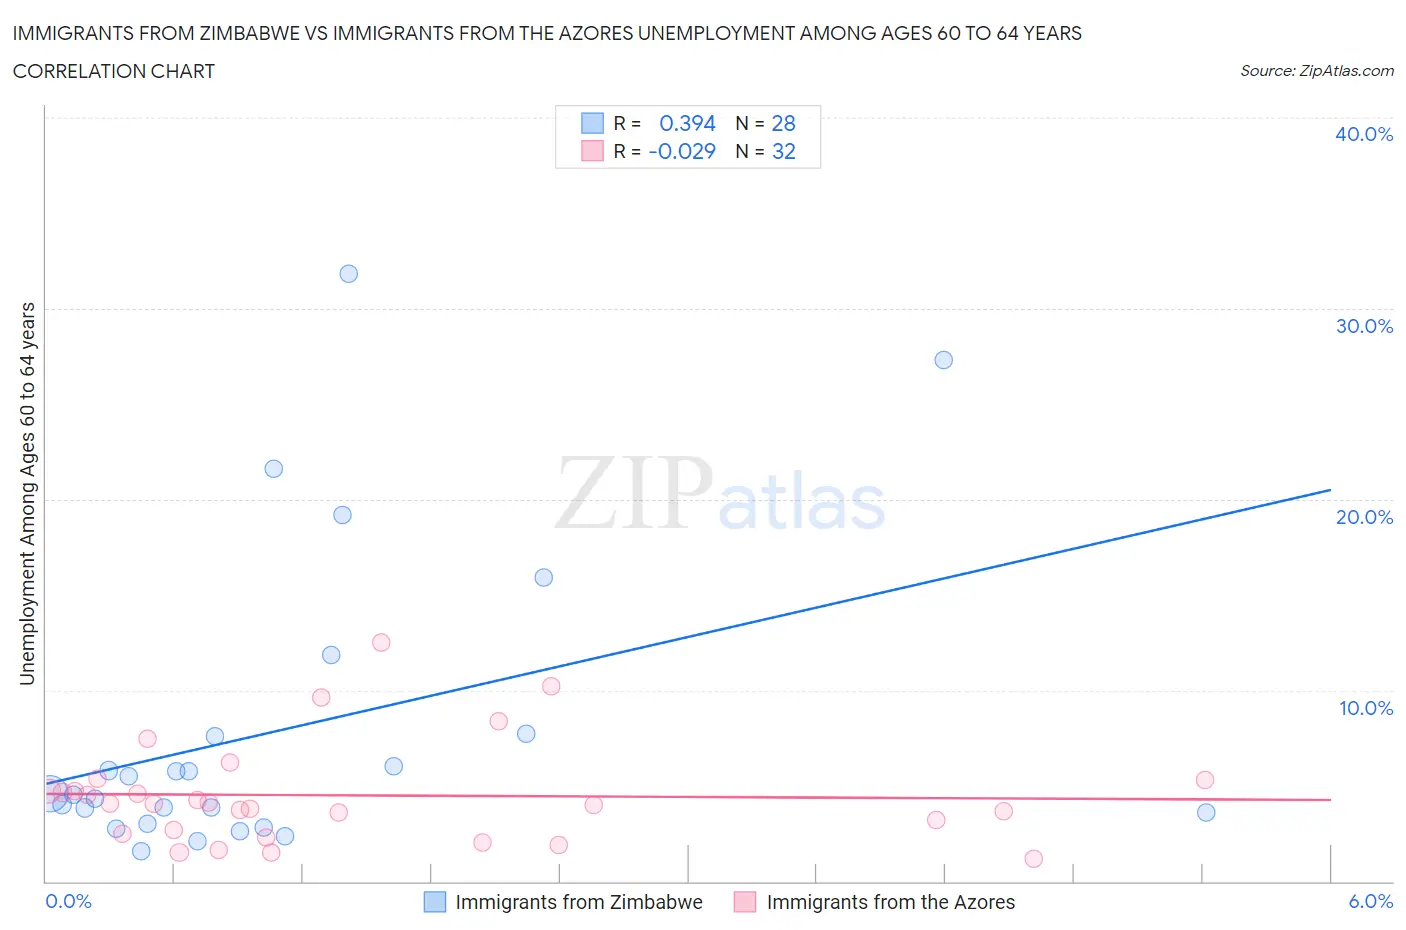
Immigrants from Zimbabwe vs Immigrants from the Azores Unemployment Among Ages 60 to 64 years Correlation Chart
The statistical analysis conducted on geographies consisting of 113,791,791 people shows a mild positive correlation between the proportion of Immigrants from Zimbabwe and unemployment rate among population between the ages 60 and 64 in the United States with a correlation coefficient (R) of 0.394 and weighted average of 4.6%. Similarly, the statistical analysis conducted on geographies consisting of 44,749,105 people shows no correlation between the proportion of Immigrants from the Azores and unemployment rate among population between the ages 60 and 64 in the United States with a correlation coefficient (R) of -0.029 and weighted average of 4.0%, a difference of 13.4%.
Unemployment Among Ages 60 to 64 years Correlation Summary
| Measurement | Immigrants from Zimbabwe | Immigrants from the Azores |
| Minimum | 1.5% | 1.2% |
| Maximum | 31.8% | 12.5% |
| Range | 30.3% | 11.3% |
| Mean | 7.9% | 4.5% |
| Median | 4.6% | 4.1% |
| Interquartile 25% (IQ1) | 3.3% | 2.6% |
| Interquartile 75% (IQ3) | 7.6% | 5.0% |
| Interquartile Range (IQR) | 4.3% | 2.4% |
| Standard Deviation (Sample) | 7.9% | 2.7% |
| Standard Deviation (Population) | 7.8% | 2.6% |
Similar Demographics by Unemployment Among Ages 60 to 64 years
Demographics Similar to Immigrants from Zimbabwe by Unemployment Among Ages 60 to 64 years
In terms of unemployment among ages 60 to 64 years, the demographic groups most similar to Immigrants from Zimbabwe are Scotch-Irish (4.6%, a difference of 0.050%), Scottish (4.6%, a difference of 0.090%), Immigrants from Kenya (4.6%, a difference of 0.20%), Kenyan (4.6%, a difference of 0.21%), and Assyrian/Chaldean/Syriac (4.5%, a difference of 0.22%).
| Demographics | Rating | Rank | Unemployment Among Ages 60 to 64 years |
| Immigrants | Sudan | 100.0 /100 | #41 | Exceptional 4.5% |
| English | 100.0 /100 | #42 | Exceptional 4.5% |
| Swedes | 100.0 /100 | #43 | Exceptional 4.5% |
| Europeans | 100.0 /100 | #44 | Exceptional 4.5% |
| Liberians | 99.9 /100 | #45 | Exceptional 4.5% |
| Bhutanese | 99.9 /100 | #46 | Exceptional 4.5% |
| Assyrians/Chaldeans/Syriacs | 99.9 /100 | #47 | Exceptional 4.5% |
| Immigrants | Zimbabwe | 99.9 /100 | #48 | Exceptional 4.6% |
| Scotch-Irish | 99.9 /100 | #49 | Exceptional 4.6% |
| Scottish | 99.9 /100 | #50 | Exceptional 4.6% |
| Immigrants | Kenya | 99.9 /100 | #51 | Exceptional 4.6% |
| Kenyans | 99.9 /100 | #52 | Exceptional 4.6% |
| Immigrants | Moldova | 99.9 /100 | #53 | Exceptional 4.6% |
| Dutch | 99.9 /100 | #54 | Exceptional 4.6% |
| Bangladeshis | 99.9 /100 | #55 | Exceptional 4.6% |
Demographics Similar to Immigrants from the Azores by Unemployment Among Ages 60 to 64 years
In terms of unemployment among ages 60 to 64 years, the demographic groups most similar to Immigrants from the Azores are Hmong (4.0%, a difference of 0.010%), Chinese (4.0%, a difference of 0.43%), Immigrants from Congo (4.1%, a difference of 2.7%), Fijian (3.9%, a difference of 3.3%), and Lumbee (4.2%, a difference of 3.7%).
| Demographics | Rating | Rank | Unemployment Among Ages 60 to 64 years |
| Marshallese | 100.0 /100 | #1 | Exceptional 3.7% |
| Fijians | 100.0 /100 | #2 | Exceptional 3.9% |
| Chinese | 100.0 /100 | #3 | Exceptional 4.0% |
| Hmong | 100.0 /100 | #4 | Exceptional 4.0% |
| Immigrants | Azores | 100.0 /100 | #5 | Exceptional 4.0% |
| Immigrants | Congo | 100.0 /100 | #6 | Exceptional 4.1% |
| Lumbee | 100.0 /100 | #7 | Exceptional 4.2% |
| Immigrants | Micronesia | 100.0 /100 | #8 | Exceptional 4.2% |
| Indonesians | 100.0 /100 | #9 | Exceptional 4.2% |
| Immigrants | Bosnia and Herzegovina | 100.0 /100 | #10 | Exceptional 4.2% |
| Luxembourgers | 100.0 /100 | #11 | Exceptional 4.3% |
| Immigrants | Cuba | 100.0 /100 | #12 | Exceptional 4.3% |
| Chickasaw | 100.0 /100 | #13 | Exceptional 4.3% |
| Norwegians | 100.0 /100 | #14 | Exceptional 4.3% |
| Sudanese | 100.0 /100 | #15 | Exceptional 4.3% |