Immigrants from Zaire vs Immigrants from Poland Disability
COMPARE
Immigrants from Zaire
Immigrants from Poland
Disability
Disability Comparison
Immigrants from Zaire
Immigrants from Poland
11.9%
DISABILITY
21.8/ 100
METRIC RATING
189th/ 347
METRIC RANK
11.1%
DISABILITY
99.1/ 100
METRIC RATING
81st/ 347
METRIC RANK
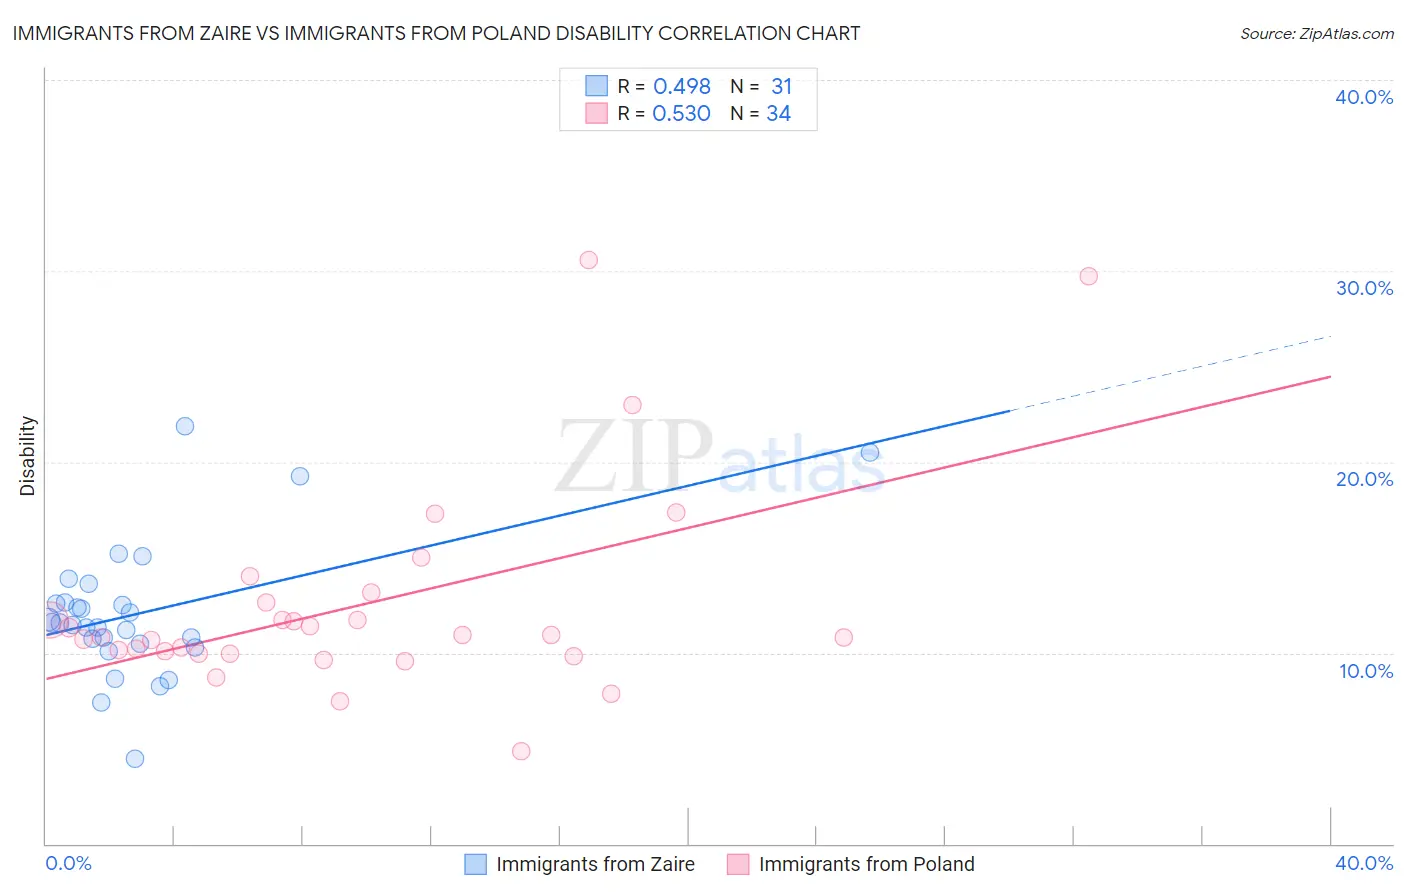
Immigrants from Zaire vs Immigrants from Poland Disability Correlation Chart
The statistical analysis conducted on geographies consisting of 107,255,080 people shows a moderate positive correlation between the proportion of Immigrants from Zaire and percentage of population with a disability in the United States with a correlation coefficient (R) of 0.498 and weighted average of 11.9%. Similarly, the statistical analysis conducted on geographies consisting of 304,838,062 people shows a substantial positive correlation between the proportion of Immigrants from Poland and percentage of population with a disability in the United States with a correlation coefficient (R) of 0.530 and weighted average of 11.1%, a difference of 7.0%.
Disability Correlation Summary
| Measurement | Immigrants from Zaire | Immigrants from Poland |
| Minimum | 4.4% | 4.8% |
| Maximum | 21.9% | 30.6% |
| Range | 17.5% | 25.7% |
| Mean | 12.1% | 12.5% |
| Median | 11.6% | 10.9% |
| Interquartile 25% (IQ1) | 10.5% | 10.0% |
| Interquartile 75% (IQ3) | 12.6% | 12.6% |
| Interquartile Range (IQR) | 2.1% | 2.7% |
| Standard Deviation (Sample) | 3.6% | 5.5% |
| Standard Deviation (Population) | 3.5% | 5.4% |
Similar Demographics by Disability
Demographics Similar to Immigrants from Zaire by Disability
In terms of disability, the demographic groups most similar to Immigrants from Zaire are Immigrants from West Indies (11.9%, a difference of 0.050%), Immigrants from Mexico (11.9%, a difference of 0.12%), Ute (11.9%, a difference of 0.16%), Lithuanian (11.9%, a difference of 0.21%), and Immigrants from Bosnia and Herzegovina (11.9%, a difference of 0.26%).
| Demographics | Rating | Rank | Disability |
| Icelanders | 34.0 /100 | #182 | Fair 11.8% |
| Hondurans | 31.2 /100 | #183 | Fair 11.8% |
| Iraqis | 30.0 /100 | #184 | Fair 11.8% |
| Immigrants | Burma/Myanmar | 28.5 /100 | #185 | Fair 11.8% |
| Immigrants | Scotland | 28.2 /100 | #186 | Fair 11.8% |
| Lebanese | 27.9 /100 | #187 | Fair 11.8% |
| Immigrants | Mexico | 23.8 /100 | #188 | Fair 11.9% |
| Immigrants | Zaire | 21.8 /100 | #189 | Fair 11.9% |
| Immigrants | West Indies | 21.1 /100 | #190 | Fair 11.9% |
| Ute | 19.5 /100 | #191 | Poor 11.9% |
| Lithuanians | 18.8 /100 | #192 | Poor 11.9% |
| Immigrants | Bosnia and Herzegovina | 18.0 /100 | #193 | Poor 11.9% |
| Somalis | 17.3 /100 | #194 | Poor 11.9% |
| Barbadians | 15.8 /100 | #195 | Poor 11.9% |
| Serbians | 15.4 /100 | #196 | Poor 11.9% |
Demographics Similar to Immigrants from Poland by Disability
In terms of disability, the demographic groups most similar to Immigrants from Poland are Chilean (11.1%, a difference of 0.050%), Immigrants from Switzerland (11.1%, a difference of 0.080%), Immigrants from Sierra Leone (11.1%, a difference of 0.090%), Immigrants from Belarus (11.1%, a difference of 0.24%), and Immigrants from Russia (11.1%, a difference of 0.24%).
| Demographics | Rating | Rank | Disability |
| Immigrants | Serbia | 99.4 /100 | #74 | Exceptional 11.0% |
| Immigrants | Vietnam | 99.4 /100 | #75 | Exceptional 11.0% |
| Sierra Leoneans | 99.3 /100 | #76 | Exceptional 11.0% |
| Immigrants | Belgium | 99.3 /100 | #77 | Exceptional 11.0% |
| Immigrants | Cameroon | 99.3 /100 | #78 | Exceptional 11.1% |
| Immigrants | Jordan | 99.3 /100 | #79 | Exceptional 11.1% |
| Immigrants | Ireland | 99.3 /100 | #80 | Exceptional 11.1% |
| Immigrants | Poland | 99.1 /100 | #81 | Exceptional 11.1% |
| Chileans | 99.1 /100 | #82 | Exceptional 11.1% |
| Immigrants | Switzerland | 99.0 /100 | #83 | Exceptional 11.1% |
| Immigrants | Sierra Leone | 99.0 /100 | #84 | Exceptional 11.1% |
| Immigrants | Belarus | 98.9 /100 | #85 | Exceptional 11.1% |
| Immigrants | Russia | 98.9 /100 | #86 | Exceptional 11.1% |
| Palestinians | 98.9 /100 | #87 | Exceptional 11.1% |
| Immigrants | Romania | 98.5 /100 | #88 | Exceptional 11.2% |