Immigrants from Yemen vs Thai Doctorate Degree
COMPARE
Immigrants from Yemen
Thai
Doctorate Degree
Doctorate Degree Comparison
Immigrants from Yemen
Thais
1.4%
DOCTORATE DEGREE
0.2/ 100
METRIC RATING
293rd/ 347
METRIC RANK
2.8%
DOCTORATE DEGREE
100.0/ 100
METRIC RATING
21st/ 347
METRIC RANK
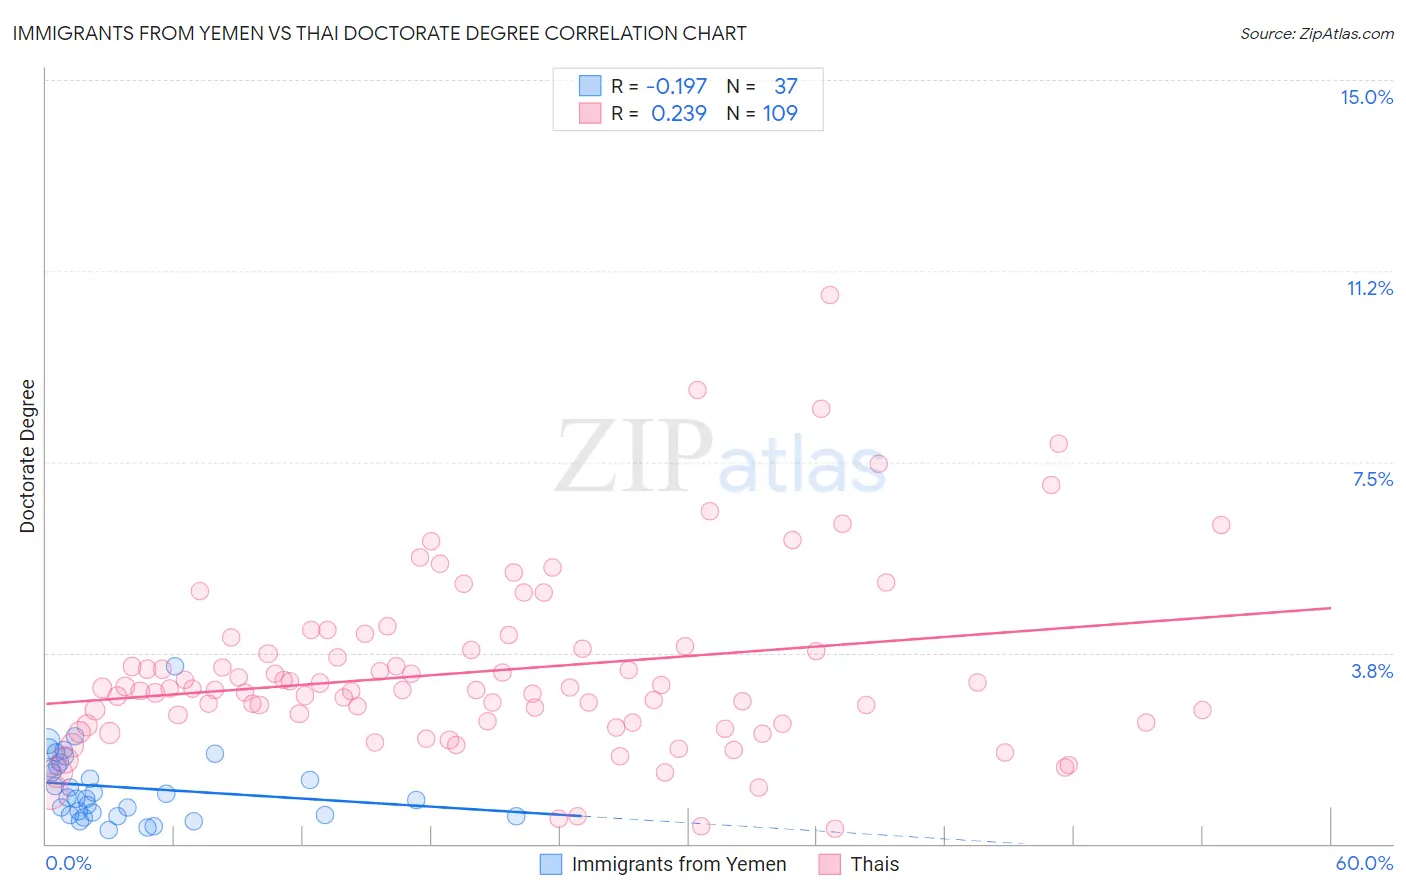
Immigrants from Yemen vs Thai Doctorate Degree Correlation Chart
The statistical analysis conducted on geographies consisting of 82,189,372 people shows a poor negative correlation between the proportion of Immigrants from Yemen and percentage of population with at least doctorate degree education in the United States with a correlation coefficient (R) of -0.197 and weighted average of 1.4%. Similarly, the statistical analysis conducted on geographies consisting of 470,013,150 people shows a weak positive correlation between the proportion of Thais and percentage of population with at least doctorate degree education in the United States with a correlation coefficient (R) of 0.239 and weighted average of 2.8%, a difference of 93.1%.
Doctorate Degree Correlation Summary
| Measurement | Immigrants from Yemen | Thai |
| Minimum | 0.27% | 0.30% |
| Maximum | 3.5% | 10.8% |
| Range | 3.2% | 10.5% |
| Mean | 1.1% | 3.4% |
| Median | 0.91% | 3.0% |
| Interquartile 25% (IQ1) | 0.56% | 2.4% |
| Interquartile 75% (IQ3) | 1.6% | 3.8% |
| Interquartile Range (IQR) | 1.0% | 1.5% |
| Standard Deviation (Sample) | 0.67% | 1.8% |
| Standard Deviation (Population) | 0.66% | 1.8% |
Similar Demographics by Doctorate Degree
Demographics Similar to Immigrants from Yemen by Doctorate Degree
In terms of doctorate degree, the demographic groups most similar to Immigrants from Yemen are Alaska Native (1.4%, a difference of 0.59%), Samoan (1.4%, a difference of 0.71%), Black/African American (1.4%, a difference of 0.76%), Choctaw (1.4%, a difference of 0.99%), and Cape Verdean (1.4%, a difference of 1.0%).
| Demographics | Rating | Rank | Doctorate Degree |
| Cherokee | 0.3 /100 | #286 | Tragic 1.5% |
| Cajuns | 0.3 /100 | #287 | Tragic 1.5% |
| Immigrants | El Salvador | 0.3 /100 | #288 | Tragic 1.4% |
| Cape Verdeans | 0.3 /100 | #289 | Tragic 1.4% |
| Choctaw | 0.3 /100 | #290 | Tragic 1.4% |
| Blacks/African Americans | 0.3 /100 | #291 | Tragic 1.4% |
| Alaska Natives | 0.3 /100 | #292 | Tragic 1.4% |
| Immigrants | Yemen | 0.2 /100 | #293 | Tragic 1.4% |
| Samoans | 0.2 /100 | #294 | Tragic 1.4% |
| Guatemalans | 0.2 /100 | #295 | Tragic 1.4% |
| Immigrants | Ecuador | 0.2 /100 | #296 | Tragic 1.4% |
| Tsimshian | 0.2 /100 | #297 | Tragic 1.4% |
| Puerto Ricans | 0.1 /100 | #298 | Tragic 1.4% |
| Belizeans | 0.1 /100 | #299 | Tragic 1.4% |
| Immigrants | Guatemala | 0.1 /100 | #300 | Tragic 1.4% |
Demographics Similar to Thais by Doctorate Degree
In terms of doctorate degree, the demographic groups most similar to Thais are Mongolian (2.8%, a difference of 0.20%), Immigrants from Denmark (2.8%, a difference of 0.33%), Immigrants from Hong Kong (2.8%, a difference of 0.35%), Immigrants from Japan (2.8%, a difference of 0.70%), and Immigrants from Sri Lanka (2.8%, a difference of 1.1%).
| Demographics | Rating | Rank | Doctorate Degree |
| Immigrants | France | 100.0 /100 | #14 | Exceptional 2.9% |
| Immigrants | India | 100.0 /100 | #15 | Exceptional 2.8% |
| Eastern Europeans | 100.0 /100 | #16 | Exceptional 2.8% |
| Immigrants | Australia | 100.0 /100 | #17 | Exceptional 2.8% |
| Immigrants | Sri Lanka | 100.0 /100 | #18 | Exceptional 2.8% |
| Immigrants | Japan | 100.0 /100 | #19 | Exceptional 2.8% |
| Immigrants | Hong Kong | 100.0 /100 | #20 | Exceptional 2.8% |
| Thais | 100.0 /100 | #21 | Exceptional 2.8% |
| Mongolians | 100.0 /100 | #22 | Exceptional 2.8% |
| Immigrants | Denmark | 100.0 /100 | #23 | Exceptional 2.8% |
| Israelis | 100.0 /100 | #24 | Exceptional 2.7% |
| Immigrants | Saudi Arabia | 100.0 /100 | #25 | Exceptional 2.7% |
| Turks | 100.0 /100 | #26 | Exceptional 2.7% |
| Immigrants | Turkey | 100.0 /100 | #27 | Exceptional 2.6% |
| Burmese | 100.0 /100 | #28 | Exceptional 2.6% |