Immigrants from Yemen vs Cuban Householder Income Over 65 years
COMPARE
Immigrants from Yemen
Cuban
Householder Income Over 65 years
Householder Income Over 65 years Comparison
Immigrants from Yemen
Cubans
$47,527
HOUSEHOLDER INCOME OVER 65 YEARS
0.0/ 100
METRIC RATING
340th/ 347
METRIC RANK
$49,152
HOUSEHOLDER INCOME OVER 65 YEARS
0.0/ 100
METRIC RATING
336th/ 347
METRIC RANK
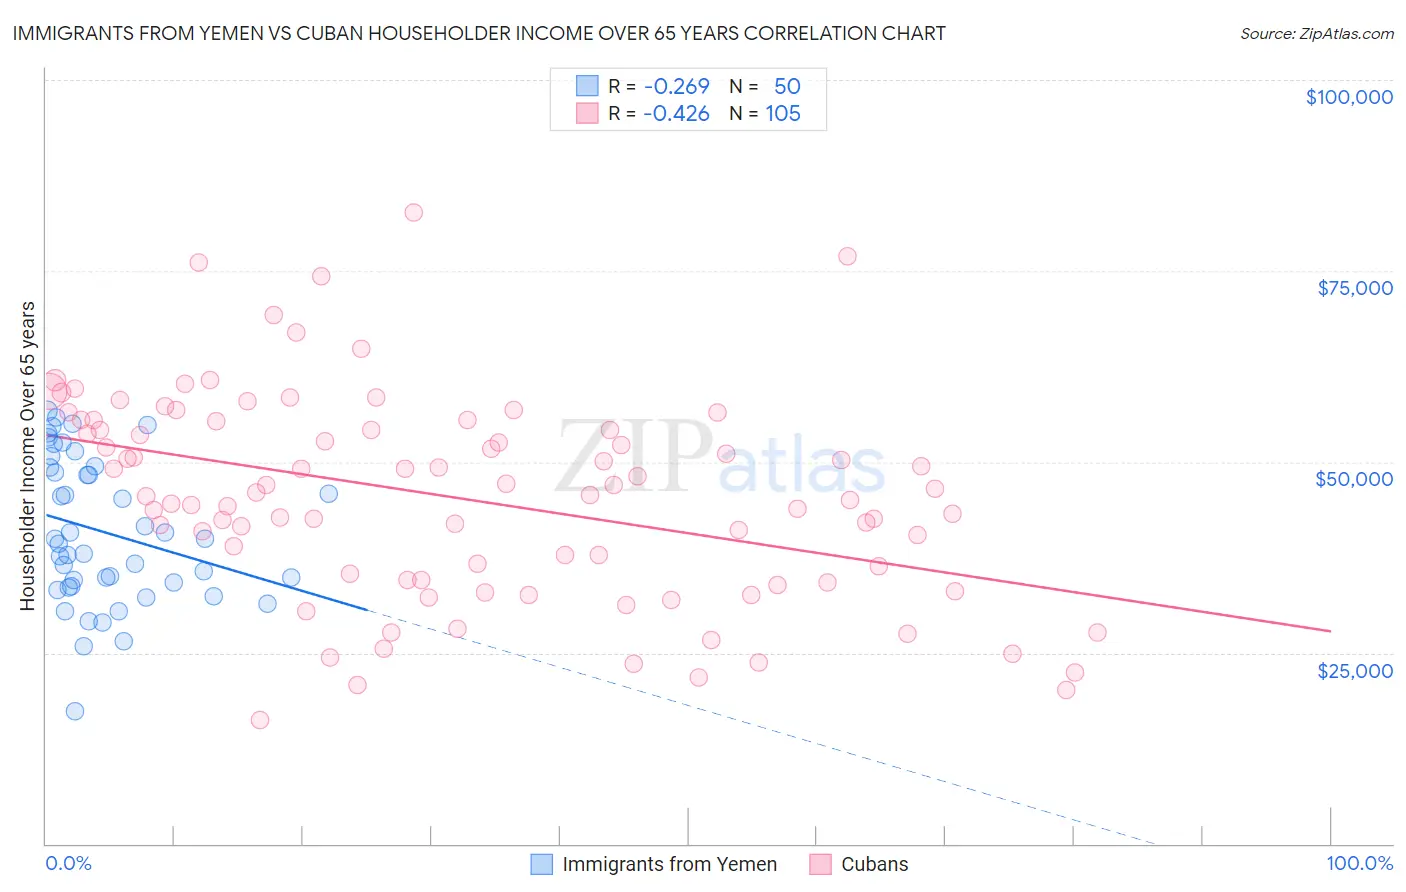
Immigrants from Yemen vs Cuban Householder Income Over 65 years Correlation Chart
The statistical analysis conducted on geographies consisting of 82,406,704 people shows a weak negative correlation between the proportion of Immigrants from Yemen and household income with householder over the age of 65 in the United States with a correlation coefficient (R) of -0.269 and weighted average of $47,527. Similarly, the statistical analysis conducted on geographies consisting of 447,397,071 people shows a moderate negative correlation between the proportion of Cubans and household income with householder over the age of 65 in the United States with a correlation coefficient (R) of -0.426 and weighted average of $49,152, a difference of 3.4%.
Householder Income Over 65 years Correlation Summary
| Measurement | Immigrants from Yemen | Cuban |
| Minimum | $17,404 | $16,239 |
| Maximum | $56,646 | $82,682 |
| Range | $39,242 | $66,443 |
| Mean | $40,803 | $45,309 |
| Median | $39,631 | $45,658 |
| Interquartile 25% (IQ1) | $33,662 | $34,482 |
| Interquartile 75% (IQ3) | $49,266 | $54,771 |
| Interquartile Range (IQR) | $15,604 | $20,289 |
| Standard Deviation (Sample) | $9,491 | $13,460 |
| Standard Deviation (Population) | $9,395 | $13,396 |
Demographics Similar to Immigrants from Yemen and Cubans by Householder Income Over 65 years
In terms of householder income over 65 years, the demographic groups most similar to Immigrants from Yemen are Navajo ($47,722, a difference of 0.41%), Dominican ($46,964, a difference of 1.2%), Immigrants from Cabo Verde ($46,654, a difference of 1.9%), Immigrants from Caribbean ($48,535, a difference of 2.1%), and Tohono O'odham ($49,121, a difference of 3.4%). Similarly, the demographic groups most similar to Cubans are Tohono O'odham ($49,121, a difference of 0.060%), Crow ($49,234, a difference of 0.17%), Immigrants from Caribbean ($48,535, a difference of 1.3%), Immigrants from Dominica ($50,071, a difference of 1.9%), and Cape Verdean ($50,077, a difference of 1.9%).
| Demographics | Rating | Rank | Householder Income Over 65 years |
| Hopi | 0.0 /100 | #328 | Tragic $50,925 |
| Blacks/African Americans | 0.0 /100 | #329 | Tragic $50,779 |
| Immigrants | Grenada | 0.0 /100 | #330 | Tragic $50,747 |
| Pima | 0.0 /100 | #331 | Tragic $50,539 |
| Dutch West Indians | 0.0 /100 | #332 | Tragic $50,475 |
| Cape Verdeans | 0.0 /100 | #333 | Tragic $50,077 |
| Immigrants | Dominica | 0.0 /100 | #334 | Tragic $50,071 |
| Crow | 0.0 /100 | #335 | Tragic $49,234 |
| Cubans | 0.0 /100 | #336 | Tragic $49,152 |
| Tohono O'odham | 0.0 /100 | #337 | Tragic $49,121 |
| Immigrants | Caribbean | 0.0 /100 | #338 | Tragic $48,535 |
| Navajo | 0.0 /100 | #339 | Tragic $47,722 |
| Immigrants | Yemen | 0.0 /100 | #340 | Tragic $47,527 |
| Dominicans | 0.0 /100 | #341 | Tragic $46,964 |
| Immigrants | Cabo Verde | 0.0 /100 | #342 | Tragic $46,654 |
| Immigrants | Dominican Republic | 0.0 /100 | #343 | Tragic $45,758 |
| Houma | 0.0 /100 | #344 | Tragic $44,822 |
| Immigrants | Cuba | 0.0 /100 | #345 | Tragic $44,735 |
| Puerto Ricans | 0.0 /100 | #346 | Tragic $42,550 |
| Lumbee | 0.0 /100 | #347 | Tragic $40,550 |