Immigrants from Western Europe vs Mexican American Indian Ambulatory Disability
COMPARE
Immigrants from Western Europe
Mexican American Indian
Ambulatory Disability
Ambulatory Disability Comparison
Immigrants from Western Europe
Mexican American Indians
6.2%
AMBULATORY DISABILITY
31.6/ 100
METRIC RATING
192nd/ 347
METRIC RANK
6.3%
AMBULATORY DISABILITY
12.0/ 100
METRIC RATING
212th/ 347
METRIC RANK
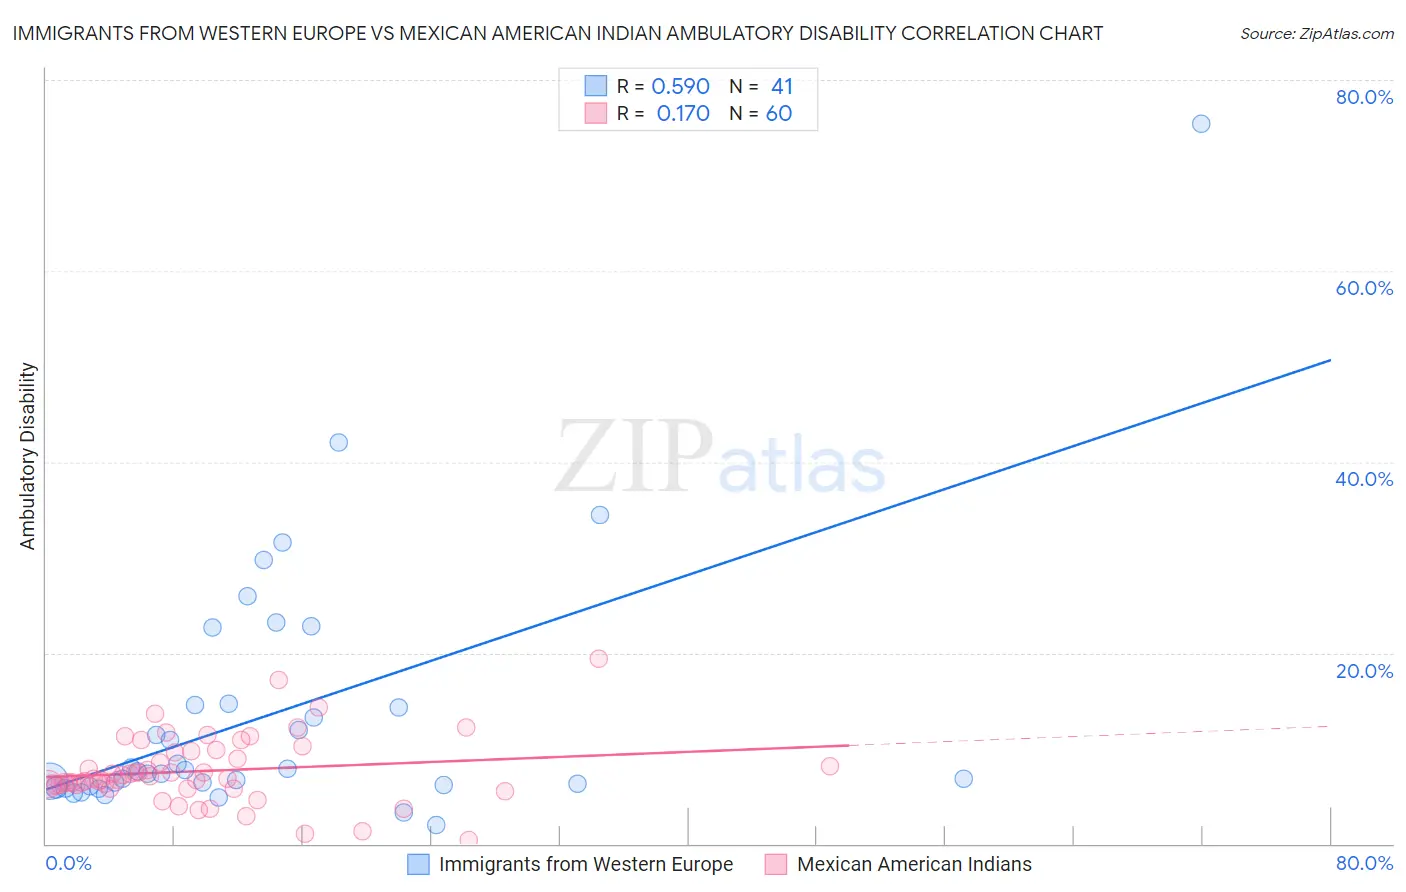
Immigrants from Western Europe vs Mexican American Indian Ambulatory Disability Correlation Chart
The statistical analysis conducted on geographies consisting of 493,880,740 people shows a substantial positive correlation between the proportion of Immigrants from Western Europe and percentage of population with ambulatory disability in the United States with a correlation coefficient (R) of 0.590 and weighted average of 6.2%. Similarly, the statistical analysis conducted on geographies consisting of 317,517,841 people shows a poor positive correlation between the proportion of Mexican American Indians and percentage of population with ambulatory disability in the United States with a correlation coefficient (R) of 0.170 and weighted average of 6.3%, a difference of 1.6%.
Ambulatory Disability Correlation Summary
| Measurement | Immigrants from Western Europe | Mexican American Indian |
| Minimum | 1.9% | 0.46% |
| Maximum | 75.4% | 19.4% |
| Range | 73.5% | 18.9% |
| Mean | 13.5% | 7.6% |
| Median | 7.6% | 6.8% |
| Interquartile 25% (IQ1) | 6.1% | 6.2% |
| Interquartile 75% (IQ3) | 14.6% | 9.6% |
| Interquartile Range (IQR) | 8.5% | 3.5% |
| Standard Deviation (Sample) | 13.7% | 3.5% |
| Standard Deviation (Population) | 13.5% | 3.5% |
Demographics Similar to Immigrants from Western Europe and Mexican American Indians by Ambulatory Disability
In terms of ambulatory disability, the demographic groups most similar to Immigrants from Western Europe are Guatemalan (6.2%, a difference of 0.10%), Alaska Native (6.2%, a difference of 0.11%), Belgian (6.2%, a difference of 0.19%), Malaysian (6.2%, a difference of 0.21%), and Polish (6.2%, a difference of 0.34%). Similarly, the demographic groups most similar to Mexican American Indians are Samoan (6.3%, a difference of 0.010%), Immigrants from Laos (6.3%, a difference of 0.15%), Immigrants from Iraq (6.3%, a difference of 0.23%), Bangladeshi (6.3%, a difference of 0.25%), and Alsatian (6.3%, a difference of 0.34%).
| Demographics | Rating | Rank | Ambulatory Disability |
| Immigrants | Western Europe | 31.6 /100 | #192 | Fair 6.2% |
| Guatemalans | 30.0 /100 | #193 | Fair 6.2% |
| Alaska Natives | 29.8 /100 | #194 | Fair 6.2% |
| Belgians | 28.6 /100 | #195 | Fair 6.2% |
| Malaysians | 28.2 /100 | #196 | Fair 6.2% |
| Poles | 26.3 /100 | #197 | Fair 6.2% |
| Immigrants | Bangladesh | 24.6 /100 | #198 | Fair 6.2% |
| Italians | 22.6 /100 | #199 | Fair 6.2% |
| Immigrants | Cambodia | 21.5 /100 | #200 | Fair 6.2% |
| Immigrants | Central America | 20.1 /100 | #201 | Fair 6.2% |
| Albanians | 19.7 /100 | #202 | Poor 6.2% |
| Immigrants | Ukraine | 18.4 /100 | #203 | Poor 6.2% |
| Immigrants | Congo | 18.2 /100 | #204 | Poor 6.2% |
| Slovenes | 18.0 /100 | #205 | Poor 6.2% |
| Finns | 17.2 /100 | #206 | Poor 6.2% |
| Alsatians | 15.1 /100 | #207 | Poor 6.3% |
| Bangladeshis | 14.2 /100 | #208 | Poor 6.3% |
| Immigrants | Iraq | 14.0 /100 | #209 | Poor 6.3% |
| Immigrants | Laos | 13.2 /100 | #210 | Poor 6.3% |
| Samoans | 12.1 /100 | #211 | Poor 6.3% |
| Mexican American Indians | 12.0 /100 | #212 | Poor 6.3% |