Immigrants from Western Europe vs Romanian Unemployment Among Ages 60 to 64 years
COMPARE
Immigrants from Western Europe
Romanian
Unemployment Among Ages 60 to 64 years
Unemployment Among Ages 60 to 64 years Comparison
Immigrants from Western Europe
Romanians
4.9%
UNEMPLOYMENT AMONG AGES 60 TO 64 YEARS
50.0/ 100
METRIC RATING
174th/ 347
METRIC RANK
4.7%
UNEMPLOYMENT AMONG AGES 60 TO 64 YEARS
98.4/ 100
METRIC RATING
92nd/ 347
METRIC RANK
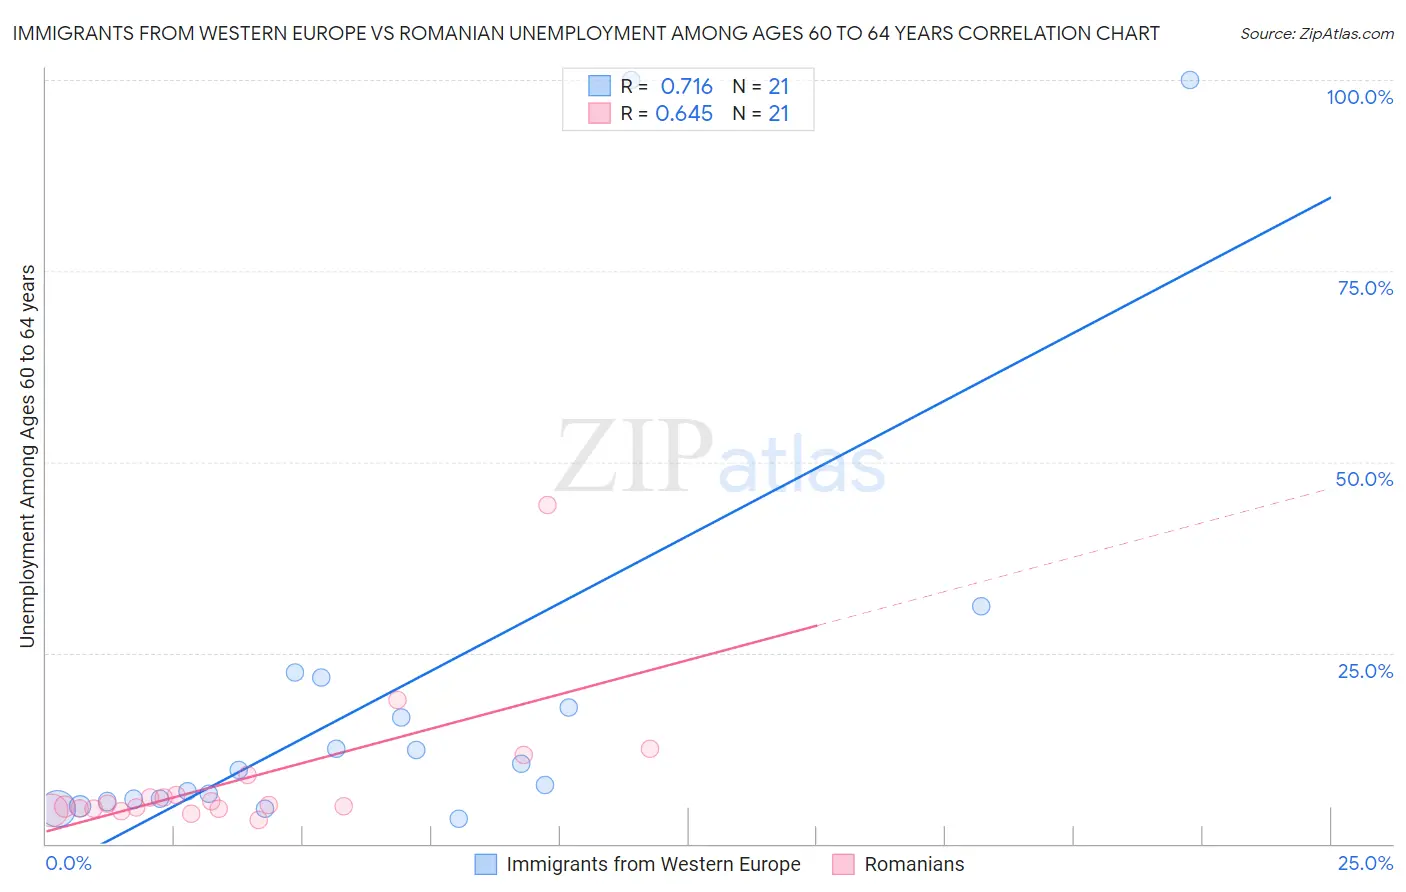
Immigrants from Western Europe vs Romanian Unemployment Among Ages 60 to 64 years Correlation Chart
The statistical analysis conducted on geographies consisting of 428,692,856 people shows a strong positive correlation between the proportion of Immigrants from Western Europe and unemployment rate among population between the ages 60 and 64 in the United States with a correlation coefficient (R) of 0.716 and weighted average of 4.9%. Similarly, the statistical analysis conducted on geographies consisting of 343,551,917 people shows a significant positive correlation between the proportion of Romanians and unemployment rate among population between the ages 60 and 64 in the United States with a correlation coefficient (R) of 0.645 and weighted average of 4.7%, a difference of 3.7%.
Unemployment Among Ages 60 to 64 years Correlation Summary
| Measurement | Immigrants from Western Europe | Romanian |
| Minimum | 3.3% | 3.2% |
| Maximum | 100.0% | 44.4% |
| Range | 96.7% | 41.2% |
| Mean | 19.5% | 8.3% |
| Median | 9.7% | 5.0% |
| Interquartile 25% (IQ1) | 5.7% | 4.6% |
| Interquartile 75% (IQ3) | 19.8% | 7.7% |
| Interquartile Range (IQR) | 14.1% | 3.1% |
| Standard Deviation (Sample) | 27.7% | 9.0% |
| Standard Deviation (Population) | 27.0% | 8.8% |
Similar Demographics by Unemployment Among Ages 60 to 64 years
Demographics Similar to Immigrants from Western Europe by Unemployment Among Ages 60 to 64 years
In terms of unemployment among ages 60 to 64 years, the demographic groups most similar to Immigrants from Western Europe are Immigrants from Hungary (4.9%, a difference of 0.010%), Immigrants from Turkey (4.9%, a difference of 0.10%), Immigrants from Latvia (4.9%, a difference of 0.11%), Bermudan (4.9%, a difference of 0.12%), and Samoan (4.9%, a difference of 0.13%).
| Demographics | Rating | Rank | Unemployment Among Ages 60 to 64 years |
| Immigrants | Northern Europe | 59.1 /100 | #167 | Average 4.8% |
| Immigrants | Southern Europe | 56.7 /100 | #168 | Average 4.8% |
| Immigrants | France | 55.5 /100 | #169 | Average 4.8% |
| Immigrants | Korea | 54.2 /100 | #170 | Average 4.8% |
| Samoans | 53.6 /100 | #171 | Average 4.9% |
| Immigrants | Turkey | 52.8 /100 | #172 | Average 4.9% |
| Immigrants | Hungary | 50.2 /100 | #173 | Average 4.9% |
| Immigrants | Western Europe | 50.0 /100 | #174 | Average 4.9% |
| Immigrants | Latvia | 46.9 /100 | #175 | Average 4.9% |
| Bermudans | 46.5 /100 | #176 | Average 4.9% |
| Immigrants | Malaysia | 44.7 /100 | #177 | Average 4.9% |
| Immigrants | Nonimmigrants | 44.5 /100 | #178 | Average 4.9% |
| Immigrants | Sweden | 44.3 /100 | #179 | Average 4.9% |
| Asians | 40.8 /100 | #180 | Average 4.9% |
| Hungarians | 40.6 /100 | #181 | Average 4.9% |
Demographics Similar to Romanians by Unemployment Among Ages 60 to 64 years
In terms of unemployment among ages 60 to 64 years, the demographic groups most similar to Romanians are Immigrants from Saudi Arabia (4.7%, a difference of 0.020%), Immigrants from Uganda (4.7%, a difference of 0.030%), Immigrants from Kuwait (4.7%, a difference of 0.030%), Serbian (4.7%, a difference of 0.10%), and Polish (4.7%, a difference of 0.12%).
| Demographics | Rating | Rank | Unemployment Among Ages 60 to 64 years |
| Immigrants | Sri Lanka | 98.9 /100 | #85 | Exceptional 4.7% |
| Immigrants | Oceania | 98.9 /100 | #86 | Exceptional 4.7% |
| Immigrants | Jordan | 98.8 /100 | #87 | Exceptional 4.7% |
| Immigrants | Bulgaria | 98.7 /100 | #88 | Exceptional 4.7% |
| Immigrants | Northern Africa | 98.7 /100 | #89 | Exceptional 4.7% |
| Immigrants | Liberia | 98.7 /100 | #90 | Exceptional 4.7% |
| Immigrants | Uganda | 98.4 /100 | #91 | Exceptional 4.7% |
| Romanians | 98.4 /100 | #92 | Exceptional 4.7% |
| Immigrants | Saudi Arabia | 98.3 /100 | #93 | Exceptional 4.7% |
| Immigrants | Kuwait | 98.3 /100 | #94 | Exceptional 4.7% |
| Serbians | 98.2 /100 | #95 | Exceptional 4.7% |
| Poles | 98.1 /100 | #96 | Exceptional 4.7% |
| Immigrants | Albania | 98.0 /100 | #97 | Exceptional 4.7% |
| Somalis | 98.0 /100 | #98 | Exceptional 4.7% |
| Egyptians | 98.0 /100 | #99 | Exceptional 4.7% |