Immigrants from Western Asia vs British West Indian Ambulatory Disability
COMPARE
Immigrants from Western Asia
British West Indian
Ambulatory Disability
Ambulatory Disability Comparison
Immigrants from Western Asia
British West Indians
5.9%
AMBULATORY DISABILITY
90.7/ 100
METRIC RATING
128th/ 347
METRIC RANK
7.0%
AMBULATORY DISABILITY
0.0/ 100
METRIC RATING
301st/ 347
METRIC RANK
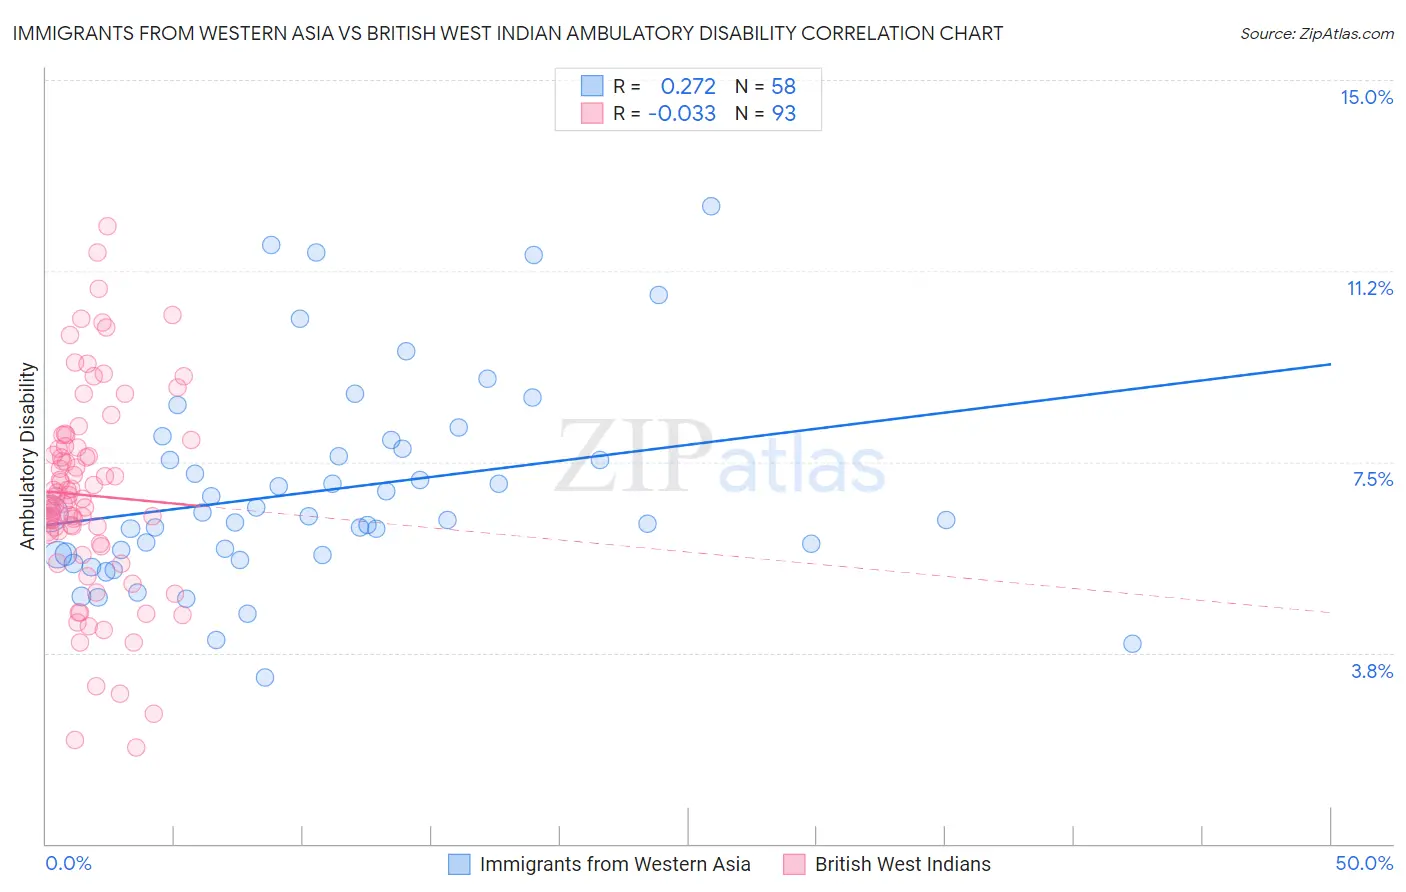
Immigrants from Western Asia vs British West Indian Ambulatory Disability Correlation Chart
The statistical analysis conducted on geographies consisting of 404,333,266 people shows a weak positive correlation between the proportion of Immigrants from Western Asia and percentage of population with ambulatory disability in the United States with a correlation coefficient (R) of 0.272 and weighted average of 5.9%. Similarly, the statistical analysis conducted on geographies consisting of 152,684,150 people shows no correlation between the proportion of British West Indians and percentage of population with ambulatory disability in the United States with a correlation coefficient (R) of -0.033 and weighted average of 7.0%, a difference of 17.3%.
Ambulatory Disability Correlation Summary
| Measurement | Immigrants from Western Asia | British West Indian |
| Minimum | 3.3% | 1.9% |
| Maximum | 12.5% | 12.1% |
| Range | 9.3% | 10.2% |
| Mean | 6.9% | 6.8% |
| Median | 6.4% | 6.8% |
| Interquartile 25% (IQ1) | 5.7% | 6.0% |
| Interquartile 75% (IQ3) | 7.8% | 7.8% |
| Interquartile Range (IQR) | 2.1% | 1.8% |
| Standard Deviation (Sample) | 2.0% | 2.0% |
| Standard Deviation (Population) | 2.0% | 2.0% |
Similar Demographics by Ambulatory Disability
Demographics Similar to Immigrants from Western Asia by Ambulatory Disability
In terms of ambulatory disability, the demographic groups most similar to Immigrants from Western Asia are Immigrants from Norway (5.9%, a difference of 0.030%), Immigrants from Nigeria (5.9%, a difference of 0.040%), Arab (5.9%, a difference of 0.13%), Immigrants from Kazakhstan (5.9%, a difference of 0.14%), and Korean (5.9%, a difference of 0.15%).
| Demographics | Rating | Rank | Ambulatory Disability |
| Costa Ricans | 92.6 /100 | #121 | Exceptional 5.9% |
| Icelanders | 92.6 /100 | #122 | Exceptional 5.9% |
| Immigrants | Russia | 92.4 /100 | #123 | Exceptional 5.9% |
| Immigrants | Middle Africa | 92.2 /100 | #124 | Exceptional 5.9% |
| Koreans | 91.6 /100 | #125 | Exceptional 5.9% |
| Arabs | 91.5 /100 | #126 | Exceptional 5.9% |
| Immigrants | Nigeria | 90.9 /100 | #127 | Exceptional 5.9% |
| Immigrants | Western Asia | 90.7 /100 | #128 | Exceptional 5.9% |
| Immigrants | Norway | 90.5 /100 | #129 | Exceptional 5.9% |
| Immigrants | Kazakhstan | 89.7 /100 | #130 | Excellent 5.9% |
| Immigrants | Costa Rica | 89.5 /100 | #131 | Excellent 5.9% |
| Immigrants | Europe | 87.8 /100 | #132 | Excellent 6.0% |
| Immigrants | Immigrants | 86.9 /100 | #133 | Excellent 6.0% |
| Ute | 86.6 /100 | #134 | Excellent 6.0% |
| Immigrants | Italy | 85.0 /100 | #135 | Excellent 6.0% |
Demographics Similar to British West Indians by Ambulatory Disability
In terms of ambulatory disability, the demographic groups most similar to British West Indians are Immigrants from Armenia (7.0%, a difference of 0.060%), African (7.0%, a difference of 0.11%), Marshallese (6.9%, a difference of 0.23%), Puget Sound Salish (6.9%, a difference of 0.24%), and Immigrants from Grenada (6.9%, a difference of 0.37%).
| Demographics | Rating | Rank | Ambulatory Disability |
| Cape Verdeans | 0.0 /100 | #294 | Tragic 6.9% |
| Crow | 0.0 /100 | #295 | Tragic 6.9% |
| Alaskan Athabascans | 0.0 /100 | #296 | Tragic 6.9% |
| French American Indians | 0.0 /100 | #297 | Tragic 6.9% |
| Immigrants | Grenada | 0.0 /100 | #298 | Tragic 6.9% |
| Puget Sound Salish | 0.0 /100 | #299 | Tragic 6.9% |
| Marshallese | 0.0 /100 | #300 | Tragic 6.9% |
| British West Indians | 0.0 /100 | #301 | Tragic 7.0% |
| Immigrants | Armenia | 0.0 /100 | #302 | Tragic 7.0% |
| Africans | 0.0 /100 | #303 | Tragic 7.0% |
| Immigrants | Cabo Verde | 0.0 /100 | #304 | Tragic 7.0% |
| Immigrants | Micronesia | 0.0 /100 | #305 | Tragic 7.0% |
| Iroquois | 0.0 /100 | #306 | Tragic 7.1% |
| Spanish Americans | 0.0 /100 | #307 | Tragic 7.1% |
| Chippewa | 0.0 /100 | #308 | Tragic 7.1% |