Immigrants from Western Asia vs Fijian Ambulatory Disability
COMPARE
Immigrants from Western Asia
Fijian
Ambulatory Disability
Ambulatory Disability Comparison
Immigrants from Western Asia
Fijians
5.9%
AMBULATORY DISABILITY
90.7/ 100
METRIC RATING
128th/ 347
METRIC RANK
6.8%
AMBULATORY DISABILITY
0.0/ 100
METRIC RATING
285th/ 347
METRIC RANK
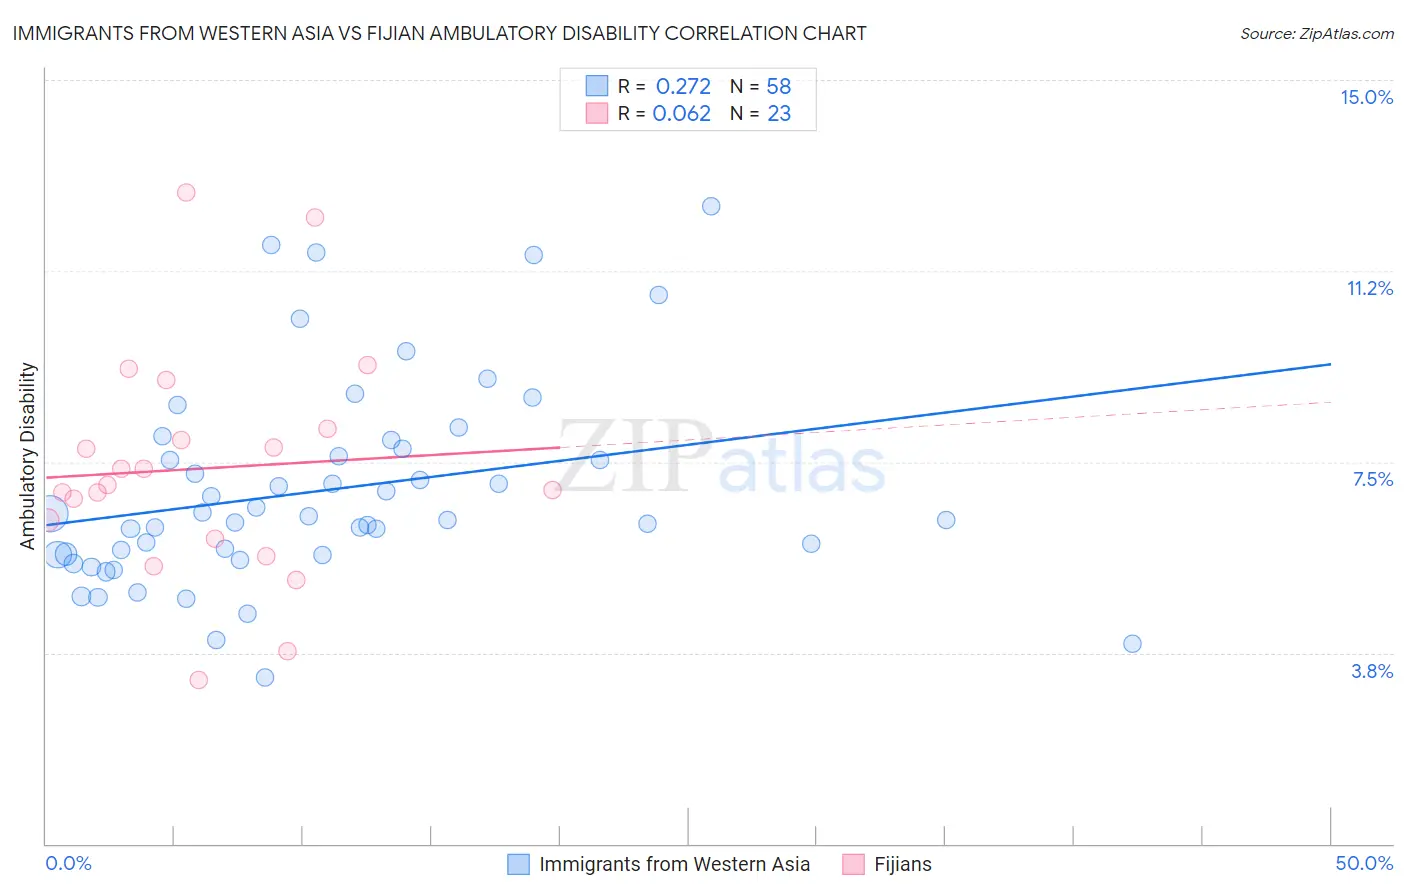
Immigrants from Western Asia vs Fijian Ambulatory Disability Correlation Chart
The statistical analysis conducted on geographies consisting of 404,333,266 people shows a weak positive correlation between the proportion of Immigrants from Western Asia and percentage of population with ambulatory disability in the United States with a correlation coefficient (R) of 0.272 and weighted average of 5.9%. Similarly, the statistical analysis conducted on geographies consisting of 55,947,275 people shows a slight positive correlation between the proportion of Fijians and percentage of population with ambulatory disability in the United States with a correlation coefficient (R) of 0.062 and weighted average of 6.8%, a difference of 14.7%.
Ambulatory Disability Correlation Summary
| Measurement | Immigrants from Western Asia | Fijian |
| Minimum | 3.3% | 3.2% |
| Maximum | 12.5% | 12.8% |
| Range | 9.3% | 9.6% |
| Mean | 6.9% | 7.4% |
| Median | 6.4% | 7.1% |
| Interquartile 25% (IQ1) | 5.7% | 6.0% |
| Interquartile 75% (IQ3) | 7.8% | 8.2% |
| Interquartile Range (IQR) | 2.1% | 2.2% |
| Standard Deviation (Sample) | 2.0% | 2.3% |
| Standard Deviation (Population) | 2.0% | 2.2% |
Similar Demographics by Ambulatory Disability
Demographics Similar to Immigrants from Western Asia by Ambulatory Disability
In terms of ambulatory disability, the demographic groups most similar to Immigrants from Western Asia are Immigrants from Norway (5.9%, a difference of 0.030%), Immigrants from Nigeria (5.9%, a difference of 0.040%), Arab (5.9%, a difference of 0.13%), Immigrants from Kazakhstan (5.9%, a difference of 0.14%), and Korean (5.9%, a difference of 0.15%).
| Demographics | Rating | Rank | Ambulatory Disability |
| Costa Ricans | 92.6 /100 | #121 | Exceptional 5.9% |
| Icelanders | 92.6 /100 | #122 | Exceptional 5.9% |
| Immigrants | Russia | 92.4 /100 | #123 | Exceptional 5.9% |
| Immigrants | Middle Africa | 92.2 /100 | #124 | Exceptional 5.9% |
| Koreans | 91.6 /100 | #125 | Exceptional 5.9% |
| Arabs | 91.5 /100 | #126 | Exceptional 5.9% |
| Immigrants | Nigeria | 90.9 /100 | #127 | Exceptional 5.9% |
| Immigrants | Western Asia | 90.7 /100 | #128 | Exceptional 5.9% |
| Immigrants | Norway | 90.5 /100 | #129 | Exceptional 5.9% |
| Immigrants | Kazakhstan | 89.7 /100 | #130 | Excellent 5.9% |
| Immigrants | Costa Rica | 89.5 /100 | #131 | Excellent 5.9% |
| Immigrants | Europe | 87.8 /100 | #132 | Excellent 6.0% |
| Immigrants | Immigrants | 86.9 /100 | #133 | Excellent 6.0% |
| Ute | 86.6 /100 | #134 | Excellent 6.0% |
| Immigrants | Italy | 85.0 /100 | #135 | Excellent 6.0% |
Demographics Similar to Fijians by Ambulatory Disability
In terms of ambulatory disability, the demographic groups most similar to Fijians are Yakama (6.8%, a difference of 0.040%), U.S. Virgin Islander (6.8%, a difference of 0.36%), Immigrants from Jamaica (6.8%, a difference of 0.41%), Immigrants from Barbados (6.8%, a difference of 0.48%), and Barbadian (6.8%, a difference of 0.64%).
| Demographics | Rating | Rank | Ambulatory Disability |
| Immigrants | West Indies | 0.1 /100 | #278 | Tragic 6.7% |
| Immigrants | Caribbean | 0.0 /100 | #279 | Tragic 6.7% |
| Pennsylvania Germans | 0.0 /100 | #280 | Tragic 6.8% |
| Yaqui | 0.0 /100 | #281 | Tragic 6.8% |
| Barbadians | 0.0 /100 | #282 | Tragic 6.8% |
| Immigrants | Barbados | 0.0 /100 | #283 | Tragic 6.8% |
| Immigrants | Jamaica | 0.0 /100 | #284 | Tragic 6.8% |
| Fijians | 0.0 /100 | #285 | Tragic 6.8% |
| Yakama | 0.0 /100 | #286 | Tragic 6.8% |
| U.S. Virgin Islanders | 0.0 /100 | #287 | Tragic 6.8% |
| Immigrants | Nonimmigrants | 0.0 /100 | #288 | Tragic 6.9% |
| Immigrants | Dominica | 0.0 /100 | #289 | Tragic 6.9% |
| Scotch-Irish | 0.0 /100 | #290 | Tragic 6.9% |
| West Indians | 0.0 /100 | #291 | Tragic 6.9% |
| Cheyenne | 0.0 /100 | #292 | Tragic 6.9% |