Immigrants from Western Africa vs Scotch-Irish Disability
COMPARE
Immigrants from Western Africa
Scotch-Irish
Disability
Disability Comparison
Immigrants from Western Africa
Scotch-Irish
11.7%
DISABILITY
47.5/ 100
METRIC RATING
176th/ 347
METRIC RANK
13.3%
DISABILITY
0.0/ 100
METRIC RATING
303rd/ 347
METRIC RANK
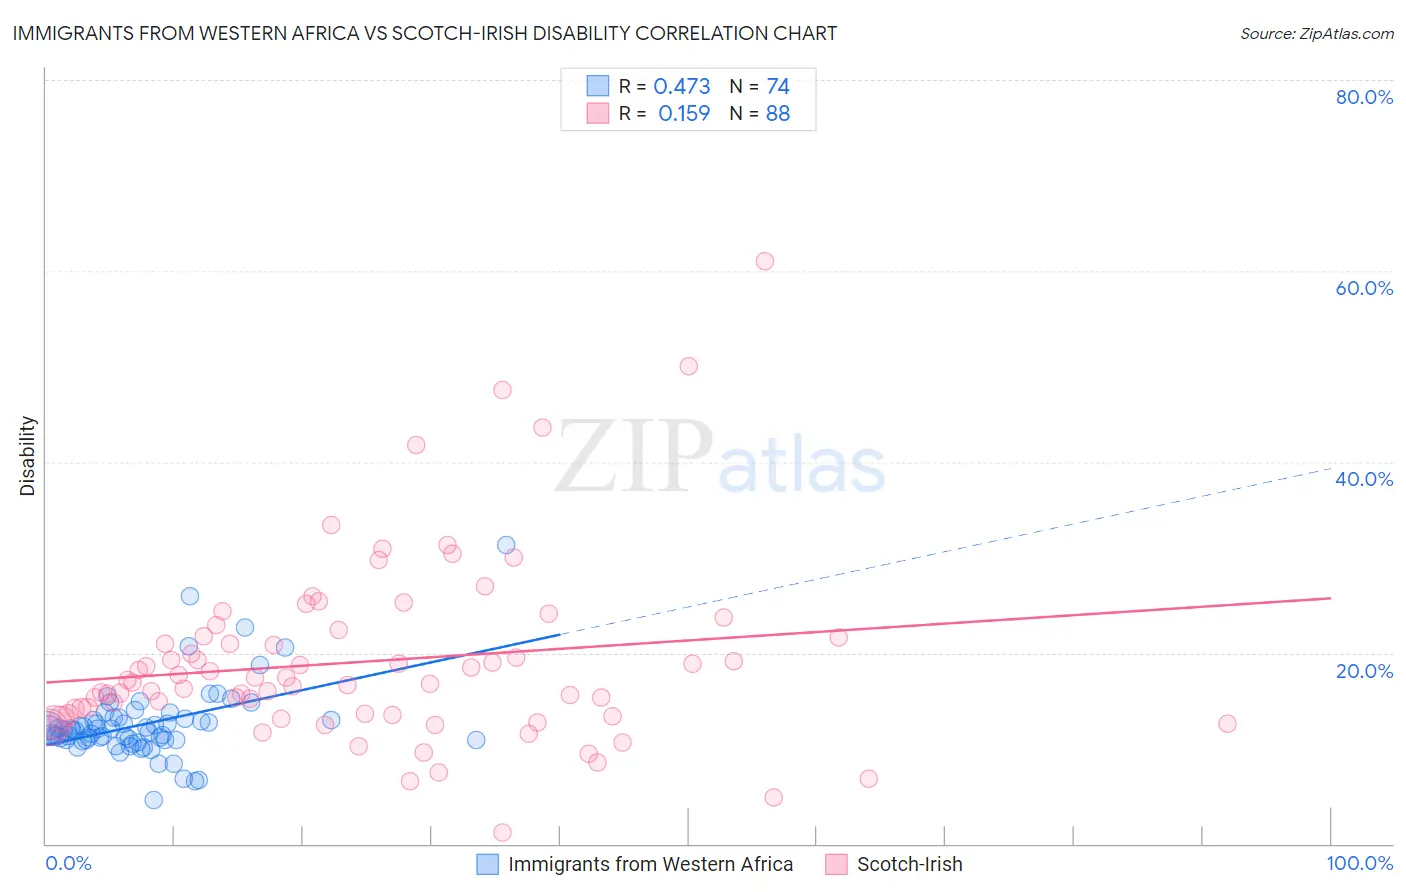
Immigrants from Western Africa vs Scotch-Irish Disability Correlation Chart
The statistical analysis conducted on geographies consisting of 357,817,429 people shows a moderate positive correlation between the proportion of Immigrants from Western Africa and percentage of population with a disability in the United States with a correlation coefficient (R) of 0.473 and weighted average of 11.7%. Similarly, the statistical analysis conducted on geographies consisting of 548,670,555 people shows a poor positive correlation between the proportion of Scotch-Irish and percentage of population with a disability in the United States with a correlation coefficient (R) of 0.159 and weighted average of 13.3%, a difference of 13.7%.
Disability Correlation Summary
| Measurement | Immigrants from Western Africa | Scotch-Irish |
| Minimum | 4.6% | 1.2% |
| Maximum | 31.3% | 61.0% |
| Range | 26.7% | 59.8% |
| Mean | 12.6% | 19.1% |
| Median | 11.9% | 16.8% |
| Interquartile 25% (IQ1) | 10.9% | 13.5% |
| Interquartile 75% (IQ3) | 13.0% | 21.7% |
| Interquartile Range (IQR) | 2.2% | 8.2% |
| Standard Deviation (Sample) | 4.0% | 9.6% |
| Standard Deviation (Population) | 4.0% | 9.6% |
Similar Demographics by Disability
Demographics Similar to Immigrants from Western Africa by Disability
In terms of disability, the demographic groups most similar to Immigrants from Western Africa are Immigrants from Central America (11.7%, a difference of 0.040%), Haitian (11.7%, a difference of 0.050%), Greek (11.7%, a difference of 0.060%), Albanian (11.7%, a difference of 0.11%), and Maltese (11.7%, a difference of 0.14%).
| Demographics | Rating | Rank | Disability |
| Immigrants | Austria | 53.4 /100 | #169 | Average 11.7% |
| Immigrants | Albania | 52.8 /100 | #170 | Average 11.7% |
| Immigrants | Southern Europe | 52.8 /100 | #171 | Average 11.7% |
| Trinidadians and Tobagonians | 52.7 /100 | #172 | Average 11.7% |
| Maltese | 50.6 /100 | #173 | Average 11.7% |
| Albanians | 50.0 /100 | #174 | Average 11.7% |
| Haitians | 48.6 /100 | #175 | Average 11.7% |
| Immigrants | Western Africa | 47.5 /100 | #176 | Average 11.7% |
| Immigrants | Central America | 46.6 /100 | #177 | Average 11.7% |
| Greeks | 46.2 /100 | #178 | Average 11.7% |
| Immigrants | Armenia | 41.9 /100 | #179 | Average 11.7% |
| Immigrants | Honduras | 37.8 /100 | #180 | Fair 11.8% |
| Immigrants | Oceania | 34.3 /100 | #181 | Fair 11.8% |
| Icelanders | 34.0 /100 | #182 | Fair 11.8% |
| Hondurans | 31.2 /100 | #183 | Fair 11.8% |
Demographics Similar to Scotch-Irish by Disability
In terms of disability, the demographic groups most similar to Scotch-Irish are Yakama (13.4%, a difference of 0.47%), Arapaho (13.2%, a difference of 0.78%), French Canadian (13.4%, a difference of 0.81%), Immigrants from Micronesia (13.2%, a difference of 0.99%), and Pennsylvania German (13.2%, a difference of 1.1%).
| Demographics | Rating | Rank | Disability |
| Central American Indians | 0.0 /100 | #296 | Tragic 13.2% |
| Hopi | 0.0 /100 | #297 | Tragic 13.2% |
| Alaska Natives | 0.0 /100 | #298 | Tragic 13.2% |
| French | 0.0 /100 | #299 | Tragic 13.2% |
| Pennsylvania Germans | 0.0 /100 | #300 | Tragic 13.2% |
| Immigrants | Micronesia | 0.0 /100 | #301 | Tragic 13.2% |
| Arapaho | 0.0 /100 | #302 | Tragic 13.2% |
| Scotch-Irish | 0.0 /100 | #303 | Tragic 13.3% |
| Yakama | 0.0 /100 | #304 | Tragic 13.4% |
| French Canadians | 0.0 /100 | #305 | Tragic 13.4% |
| Cape Verdeans | 0.0 /100 | #306 | Tragic 13.5% |
| Shoshone | 0.0 /100 | #307 | Tragic 13.5% |
| French American Indians | 0.0 /100 | #308 | Tragic 13.5% |
| Tlingit-Haida | 0.0 /100 | #309 | Tragic 13.5% |
| Blackfeet | 0.0 /100 | #310 | Tragic 13.6% |