Immigrants from West Indies vs Immigrants from Europe Self-Care Disability
COMPARE
Immigrants from West Indies
Immigrants from Europe
Self-Care Disability
Self-Care Disability Comparison
Immigrants from West Indies
Immigrants from Europe
2.8%
SELF-CARE DISABILITY
0.0/ 100
METRIC RATING
305th/ 347
METRIC RANK
2.4%
SELF-CARE DISABILITY
69.6/ 100
METRIC RATING
157th/ 347
METRIC RANK
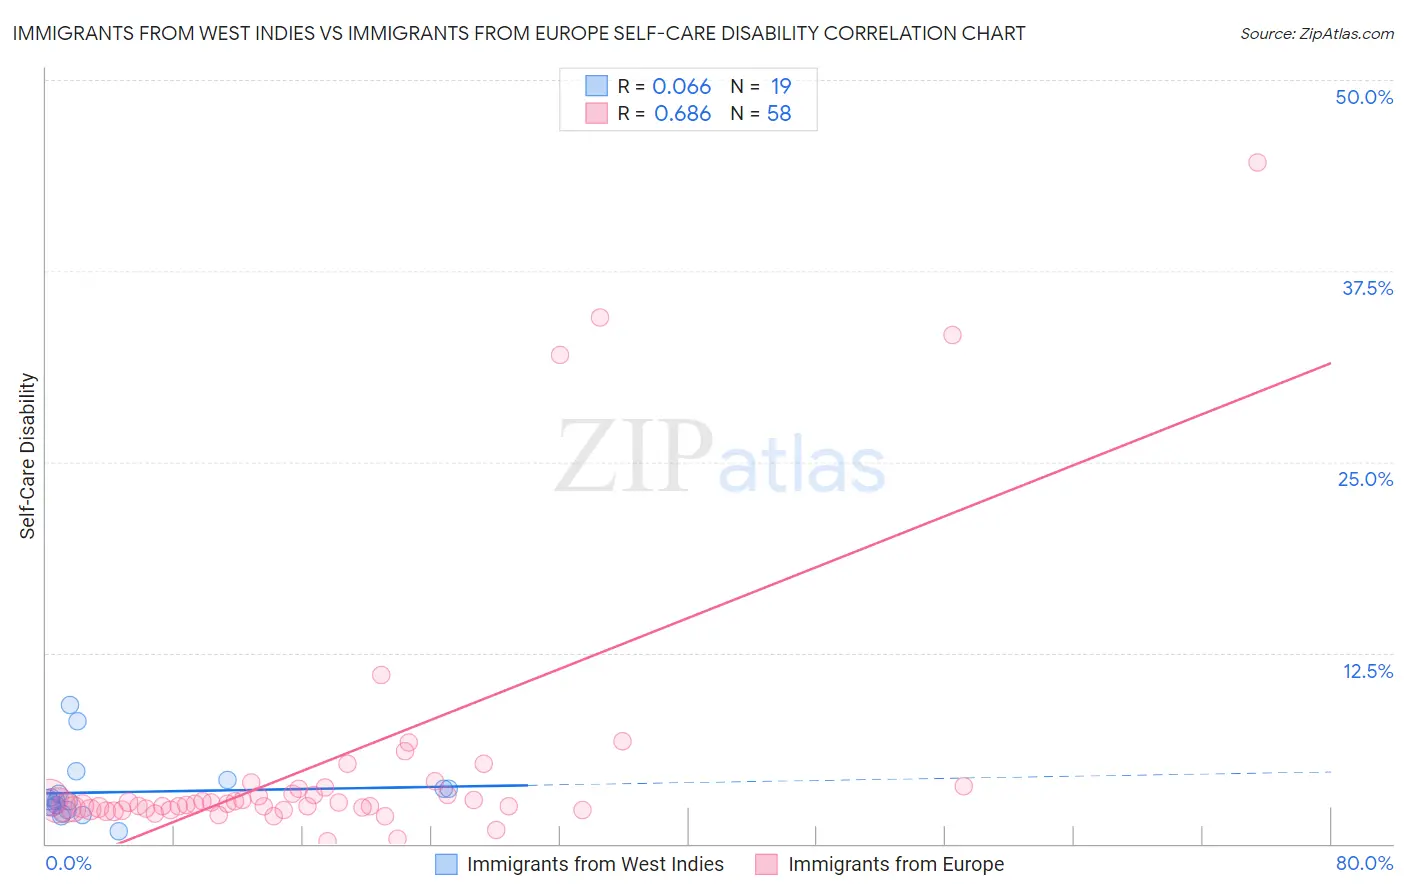
Immigrants from West Indies vs Immigrants from Europe Self-Care Disability Correlation Chart
The statistical analysis conducted on geographies consisting of 72,451,544 people shows a slight positive correlation between the proportion of Immigrants from West Indies and percentage of population with self-care disability in the United States with a correlation coefficient (R) of 0.066 and weighted average of 2.8%. Similarly, the statistical analysis conducted on geographies consisting of 545,734,078 people shows a significant positive correlation between the proportion of Immigrants from Europe and percentage of population with self-care disability in the United States with a correlation coefficient (R) of 0.686 and weighted average of 2.4%, a difference of 14.3%.
Self-Care Disability Correlation Summary
| Measurement | Immigrants from West Indies | Immigrants from Europe |
| Minimum | 0.84% | 0.20% |
| Maximum | 9.1% | 44.6% |
| Range | 8.2% | 44.4% |
| Mean | 3.4% | 5.3% |
| Median | 2.8% | 2.6% |
| Interquartile 25% (IQ1) | 2.2% | 2.3% |
| Interquartile 75% (IQ3) | 3.6% | 3.6% |
| Interquartile Range (IQR) | 1.4% | 1.3% |
| Standard Deviation (Sample) | 2.0% | 8.7% |
| Standard Deviation (Population) | 2.0% | 8.6% |
Similar Demographics by Self-Care Disability
Demographics Similar to Immigrants from West Indies by Self-Care Disability
In terms of self-care disability, the demographic groups most similar to Immigrants from West Indies are Cree (2.8%, a difference of 0.050%), Immigrants from Belize (2.8%, a difference of 0.20%), Immigrants from St. Vincent and the Grenadines (2.8%, a difference of 0.35%), Pima (2.8%, a difference of 0.39%), and Aleut (2.8%, a difference of 0.40%).
| Demographics | Rating | Rank | Self-Care Disability |
| Americans | 0.0 /100 | #298 | Tragic 2.8% |
| Immigrants | Guyana | 0.0 /100 | #299 | Tragic 2.8% |
| Immigrants | Fiji | 0.0 /100 | #300 | Tragic 2.8% |
| Pima | 0.0 /100 | #301 | Tragic 2.8% |
| Immigrants | St. Vincent and the Grenadines | 0.0 /100 | #302 | Tragic 2.8% |
| Immigrants | Belize | 0.0 /100 | #303 | Tragic 2.8% |
| Cree | 0.0 /100 | #304 | Tragic 2.8% |
| Immigrants | West Indies | 0.0 /100 | #305 | Tragic 2.8% |
| Aleuts | 0.0 /100 | #306 | Tragic 2.8% |
| Natives/Alaskans | 0.0 /100 | #307 | Tragic 2.8% |
| Immigrants | Grenada | 0.0 /100 | #308 | Tragic 2.8% |
| Bangladeshis | 0.0 /100 | #309 | Tragic 2.8% |
| British West Indians | 0.0 /100 | #310 | Tragic 2.8% |
| Puget Sound Salish | 0.0 /100 | #311 | Tragic 2.8% |
| Immigrants | Caribbean | 0.0 /100 | #312 | Tragic 2.8% |
Demographics Similar to Immigrants from Europe by Self-Care Disability
In terms of self-care disability, the demographic groups most similar to Immigrants from Europe are Nigerian (2.4%, a difference of 0.060%), Immigrants from Western Europe (2.4%, a difference of 0.060%), Immigrants from Italy (2.4%, a difference of 0.060%), Pakistani (2.4%, a difference of 0.11%), and Finnish (2.4%, a difference of 0.14%).
| Demographics | Rating | Rank | Self-Care Disability |
| Immigrants | Costa Rica | 75.1 /100 | #150 | Good 2.4% |
| Basques | 74.0 /100 | #151 | Good 2.4% |
| Tlingit-Haida | 73.5 /100 | #152 | Good 2.4% |
| Immigrants | England | 73.5 /100 | #153 | Good 2.4% |
| Italians | 72.2 /100 | #154 | Good 2.4% |
| Pakistanis | 71.4 /100 | #155 | Good 2.4% |
| Nigerians | 70.6 /100 | #156 | Good 2.4% |
| Immigrants | Europe | 69.6 /100 | #157 | Good 2.4% |
| Immigrants | Western Europe | 68.6 /100 | #158 | Good 2.4% |
| Immigrants | Italy | 68.5 /100 | #159 | Good 2.4% |
| Finns | 67.0 /100 | #160 | Good 2.4% |
| Lebanese | 66.5 /100 | #161 | Good 2.4% |
| Somalis | 63.7 /100 | #162 | Good 2.5% |
| German Russians | 62.7 /100 | #163 | Good 2.5% |
| Immigrants | Vietnam | 59.3 /100 | #164 | Average 2.5% |