Immigrants from West Indies vs Immigrants Self-Care Disability
COMPARE
Immigrants from West Indies
Immigrants
Self-Care Disability
Self-Care Disability Comparison
Immigrants from West Indies
Immigrants
2.8%
SELF-CARE DISABILITY
0.0/ 100
METRIC RATING
305th/ 347
METRIC RANK
2.5%
SELF-CARE DISABILITY
15.0/ 100
METRIC RATING
198th/ 347
METRIC RANK
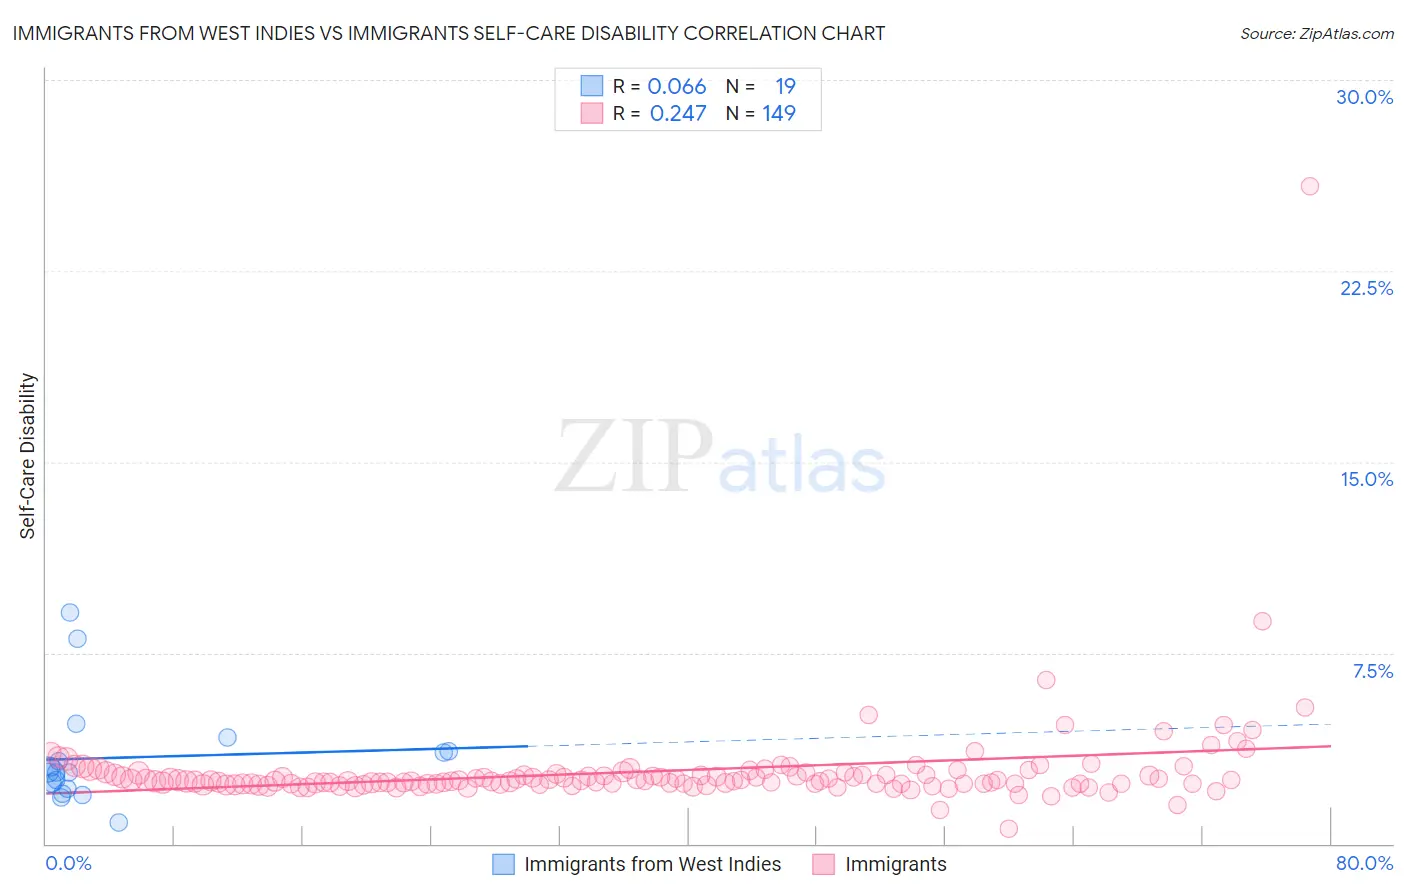
Immigrants from West Indies vs Immigrants Self-Care Disability Correlation Chart
The statistical analysis conducted on geographies consisting of 72,451,544 people shows a slight positive correlation between the proportion of Immigrants from West Indies and percentage of population with self-care disability in the United States with a correlation coefficient (R) of 0.066 and weighted average of 2.8%. Similarly, the statistical analysis conducted on geographies consisting of 575,126,463 people shows a weak positive correlation between the proportion of Immigrants and percentage of population with self-care disability in the United States with a correlation coefficient (R) of 0.247 and weighted average of 2.5%, a difference of 10.9%.
Self-Care Disability Correlation Summary
| Measurement | Immigrants from West Indies | Immigrants |
| Minimum | 0.84% | 0.58% |
| Maximum | 9.1% | 25.8% |
| Range | 8.2% | 25.3% |
| Mean | 3.4% | 2.8% |
| Median | 2.8% | 2.5% |
| Interquartile 25% (IQ1) | 2.2% | 2.4% |
| Interquartile 75% (IQ3) | 3.6% | 2.7% |
| Interquartile Range (IQR) | 1.4% | 0.37% |
| Standard Deviation (Sample) | 2.0% | 2.1% |
| Standard Deviation (Population) | 2.0% | 2.1% |
Similar Demographics by Self-Care Disability
Demographics Similar to Immigrants from West Indies by Self-Care Disability
In terms of self-care disability, the demographic groups most similar to Immigrants from West Indies are Cree (2.8%, a difference of 0.050%), Immigrants from Belize (2.8%, a difference of 0.20%), Immigrants from St. Vincent and the Grenadines (2.8%, a difference of 0.35%), Pima (2.8%, a difference of 0.39%), and Aleut (2.8%, a difference of 0.40%).
| Demographics | Rating | Rank | Self-Care Disability |
| Americans | 0.0 /100 | #298 | Tragic 2.8% |
| Immigrants | Guyana | 0.0 /100 | #299 | Tragic 2.8% |
| Immigrants | Fiji | 0.0 /100 | #300 | Tragic 2.8% |
| Pima | 0.0 /100 | #301 | Tragic 2.8% |
| Immigrants | St. Vincent and the Grenadines | 0.0 /100 | #302 | Tragic 2.8% |
| Immigrants | Belize | 0.0 /100 | #303 | Tragic 2.8% |
| Cree | 0.0 /100 | #304 | Tragic 2.8% |
| Immigrants | West Indies | 0.0 /100 | #305 | Tragic 2.8% |
| Aleuts | 0.0 /100 | #306 | Tragic 2.8% |
| Natives/Alaskans | 0.0 /100 | #307 | Tragic 2.8% |
| Immigrants | Grenada | 0.0 /100 | #308 | Tragic 2.8% |
| Bangladeshis | 0.0 /100 | #309 | Tragic 2.8% |
| British West Indians | 0.0 /100 | #310 | Tragic 2.8% |
| Puget Sound Salish | 0.0 /100 | #311 | Tragic 2.8% |
| Immigrants | Caribbean | 0.0 /100 | #312 | Tragic 2.8% |
Demographics Similar to Immigrants by Self-Care Disability
In terms of self-care disability, the demographic groups most similar to Immigrants are Crow (2.5%, a difference of 0.020%), Immigrants from Ghana (2.5%, a difference of 0.020%), Korean (2.5%, a difference of 0.050%), Immigrants from Southern Europe (2.5%, a difference of 0.060%), and Immigrants from Western Africa (2.5%, a difference of 0.16%).
| Demographics | Rating | Rank | Self-Care Disability |
| Moroccans | 22.9 /100 | #191 | Fair 2.5% |
| Soviet Union | 22.2 /100 | #192 | Fair 2.5% |
| Ukrainians | 21.4 /100 | #193 | Fair 2.5% |
| Immigrants | Germany | 17.9 /100 | #194 | Poor 2.5% |
| Immigrants | Southern Europe | 15.6 /100 | #195 | Poor 2.5% |
| Koreans | 15.5 /100 | #196 | Poor 2.5% |
| Crow | 15.2 /100 | #197 | Poor 2.5% |
| Immigrants | Immigrants | 15.0 /100 | #198 | Poor 2.5% |
| Immigrants | Ghana | 14.7 /100 | #199 | Poor 2.5% |
| Immigrants | Western Africa | 13.3 /100 | #200 | Poor 2.5% |
| Immigrants | South Eastern Asia | 12.9 /100 | #201 | Poor 2.5% |
| Slovaks | 12.6 /100 | #202 | Poor 2.5% |
| Immigrants | Lebanon | 12.4 /100 | #203 | Poor 2.5% |
| Immigrants | Bahamas | 11.9 /100 | #204 | Poor 2.5% |
| Immigrants | Russia | 11.0 /100 | #205 | Poor 2.5% |