Immigrants from West Indies vs Immigrants from Fiji Self-Care Disability
COMPARE
Immigrants from West Indies
Immigrants from Fiji
Self-Care Disability
Self-Care Disability Comparison
Immigrants from West Indies
Immigrants from Fiji
2.8%
SELF-CARE DISABILITY
0.0/ 100
METRIC RATING
305th/ 347
METRIC RANK
2.8%
SELF-CARE DISABILITY
0.0/ 100
METRIC RATING
300th/ 347
METRIC RANK
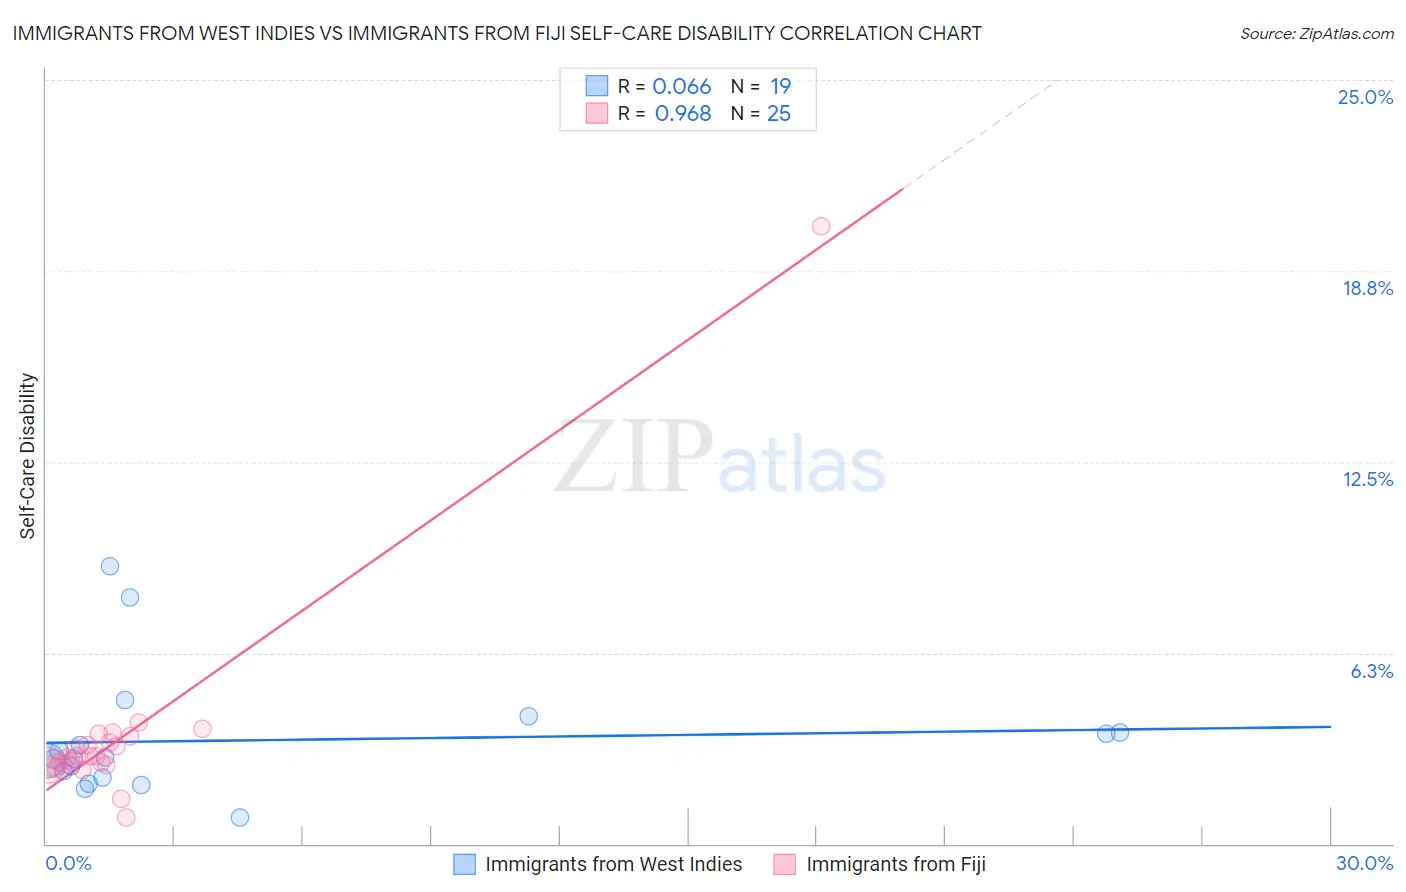
Immigrants from West Indies vs Immigrants from Fiji Self-Care Disability Correlation Chart
The statistical analysis conducted on geographies consisting of 72,451,544 people shows a slight positive correlation between the proportion of Immigrants from West Indies and percentage of population with self-care disability in the United States with a correlation coefficient (R) of 0.066 and weighted average of 2.8%. Similarly, the statistical analysis conducted on geographies consisting of 93,753,839 people shows a perfect positive correlation between the proportion of Immigrants from Fiji and percentage of population with self-care disability in the United States with a correlation coefficient (R) of 0.968 and weighted average of 2.8%, a difference of 0.48%.
Self-Care Disability Correlation Summary
| Measurement | Immigrants from West Indies | Immigrants from Fiji |
| Minimum | 0.84% | 0.86% |
| Maximum | 9.1% | 20.2% |
| Range | 8.2% | 19.4% |
| Mean | 3.4% | 3.5% |
| Median | 2.8% | 2.9% |
| Interquartile 25% (IQ1) | 2.2% | 2.6% |
| Interquartile 75% (IQ3) | 3.6% | 3.4% |
| Interquartile Range (IQR) | 1.4% | 0.86% |
| Standard Deviation (Sample) | 2.0% | 3.5% |
| Standard Deviation (Population) | 2.0% | 3.5% |
Demographics Similar to Immigrants from West Indies and Immigrants from Fiji by Self-Care Disability
In terms of self-care disability, the demographic groups most similar to Immigrants from West Indies are Cree (2.8%, a difference of 0.050%), Immigrants from Belize (2.8%, a difference of 0.20%), Immigrants from St. Vincent and the Grenadines (2.8%, a difference of 0.35%), Pima (2.8%, a difference of 0.39%), and Aleut (2.8%, a difference of 0.40%). Similarly, the demographic groups most similar to Immigrants from Fiji are Pima (2.8%, a difference of 0.090%), Immigrants from St. Vincent and the Grenadines (2.8%, a difference of 0.13%), Immigrants from Belize (2.8%, a difference of 0.28%), Cree (2.8%, a difference of 0.43%), and Immigrants from Guyana (2.8%, a difference of 0.47%).
| Demographics | Rating | Rank | Self-Care Disability |
| Central American Indians | 0.0 /100 | #292 | Tragic 2.7% |
| Belizeans | 0.0 /100 | #293 | Tragic 2.7% |
| Blackfeet | 0.0 /100 | #294 | Tragic 2.7% |
| Barbadians | 0.0 /100 | #295 | Tragic 2.7% |
| Immigrants | Portugal | 0.0 /100 | #296 | Tragic 2.8% |
| West Indians | 0.0 /100 | #297 | Tragic 2.8% |
| Americans | 0.0 /100 | #298 | Tragic 2.8% |
| Immigrants | Guyana | 0.0 /100 | #299 | Tragic 2.8% |
| Immigrants | Fiji | 0.0 /100 | #300 | Tragic 2.8% |
| Pima | 0.0 /100 | #301 | Tragic 2.8% |
| Immigrants | St. Vincent and the Grenadines | 0.0 /100 | #302 | Tragic 2.8% |
| Immigrants | Belize | 0.0 /100 | #303 | Tragic 2.8% |
| Cree | 0.0 /100 | #304 | Tragic 2.8% |
| Immigrants | West Indies | 0.0 /100 | #305 | Tragic 2.8% |
| Aleuts | 0.0 /100 | #306 | Tragic 2.8% |
| Natives/Alaskans | 0.0 /100 | #307 | Tragic 2.8% |
| Immigrants | Grenada | 0.0 /100 | #308 | Tragic 2.8% |
| Bangladeshis | 0.0 /100 | #309 | Tragic 2.8% |
| British West Indians | 0.0 /100 | #310 | Tragic 2.8% |
| Puget Sound Salish | 0.0 /100 | #311 | Tragic 2.8% |
| Immigrants | Caribbean | 0.0 /100 | #312 | Tragic 2.8% |