Immigrants from Liberia vs Immigrants from Europe Self-Care Disability
COMPARE
Immigrants from Liberia
Immigrants from Europe
Self-Care Disability
Self-Care Disability Comparison
Immigrants from Liberia
Immigrants from Europe
2.6%
SELF-CARE DISABILITY
0.4/ 100
METRIC RATING
251st/ 347
METRIC RANK
2.4%
SELF-CARE DISABILITY
69.6/ 100
METRIC RATING
157th/ 347
METRIC RANK
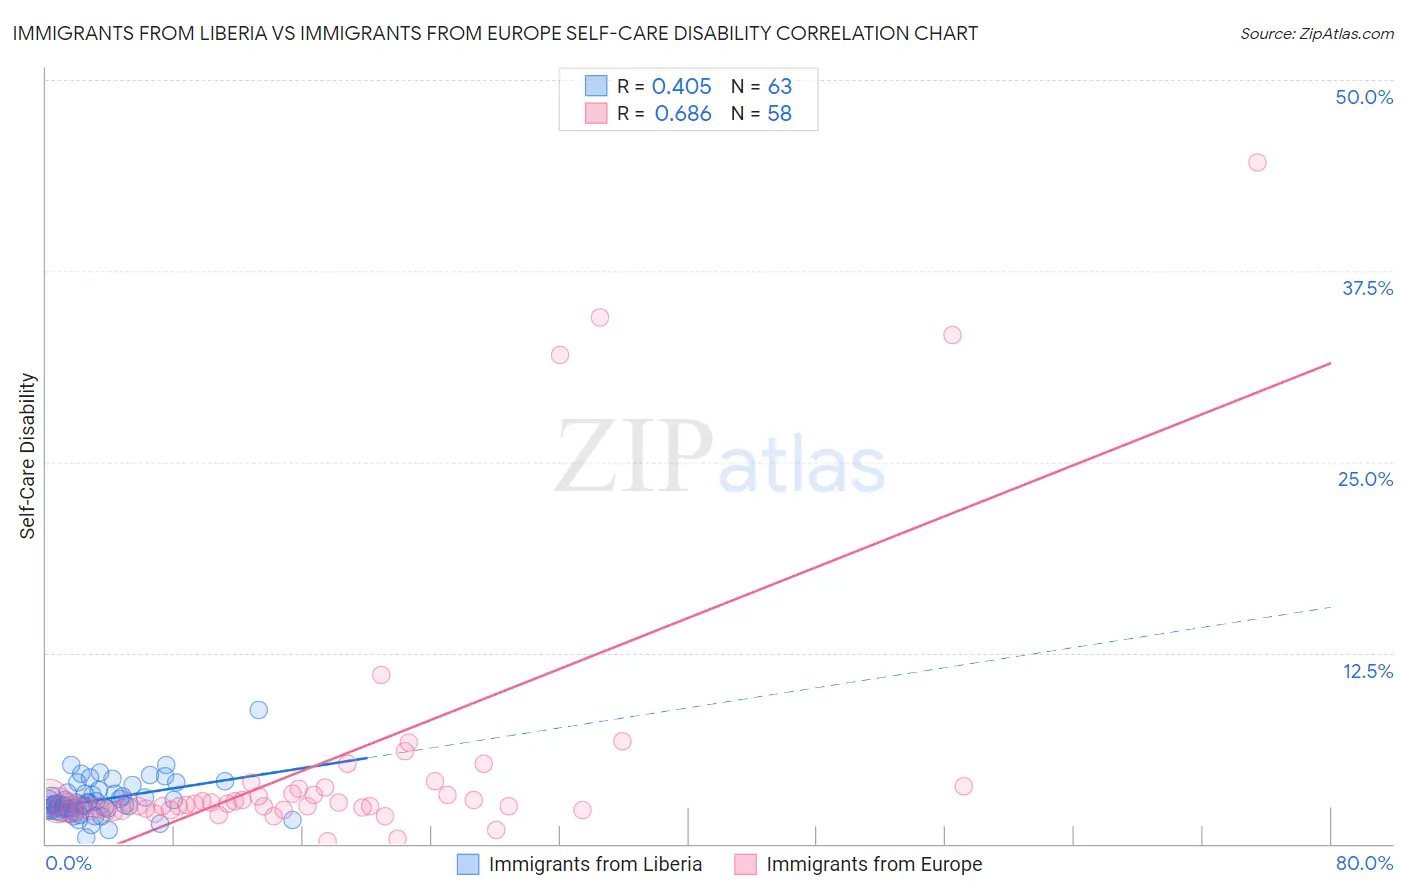
Immigrants from Liberia vs Immigrants from Europe Self-Care Disability Correlation Chart
The statistical analysis conducted on geographies consisting of 135,176,274 people shows a moderate positive correlation between the proportion of Immigrants from Liberia and percentage of population with self-care disability in the United States with a correlation coefficient (R) of 0.405 and weighted average of 2.6%. Similarly, the statistical analysis conducted on geographies consisting of 545,734,078 people shows a significant positive correlation between the proportion of Immigrants from Europe and percentage of population with self-care disability in the United States with a correlation coefficient (R) of 0.686 and weighted average of 2.4%, a difference of 7.6%.
Self-Care Disability Correlation Summary
| Measurement | Immigrants from Liberia | Immigrants from Europe |
| Minimum | 0.40% | 0.20% |
| Maximum | 8.8% | 44.6% |
| Range | 8.4% | 44.4% |
| Mean | 2.9% | 5.3% |
| Median | 2.6% | 2.6% |
| Interquartile 25% (IQ1) | 2.3% | 2.3% |
| Interquartile 75% (IQ3) | 3.3% | 3.6% |
| Interquartile Range (IQR) | 1.0% | 1.3% |
| Standard Deviation (Sample) | 1.3% | 8.7% |
| Standard Deviation (Population) | 1.2% | 8.6% |
Similar Demographics by Self-Care Disability
Demographics Similar to Immigrants from Liberia by Self-Care Disability
In terms of self-care disability, the demographic groups most similar to Immigrants from Liberia are Immigrants from Bangladesh (2.6%, a difference of 0.070%), Portuguese (2.6%, a difference of 0.080%), Immigrants from Haiti (2.6%, a difference of 0.15%), Mexican American Indian (2.6%, a difference of 0.16%), and Haitian (2.6%, a difference of 0.17%).
| Demographics | Rating | Rank | Self-Care Disability |
| Yuman | 0.8 /100 | #244 | Tragic 2.6% |
| Immigrants | Western Asia | 0.6 /100 | #245 | Tragic 2.6% |
| Cheyenne | 0.6 /100 | #246 | Tragic 2.6% |
| Immigrants | Albania | 0.6 /100 | #247 | Tragic 2.6% |
| Nicaraguans | 0.6 /100 | #248 | Tragic 2.6% |
| Mexican American Indians | 0.5 /100 | #249 | Tragic 2.6% |
| Portuguese | 0.4 /100 | #250 | Tragic 2.6% |
| Immigrants | Liberia | 0.4 /100 | #251 | Tragic 2.6% |
| Immigrants | Bangladesh | 0.4 /100 | #252 | Tragic 2.6% |
| Immigrants | Haiti | 0.3 /100 | #253 | Tragic 2.6% |
| Haitians | 0.3 /100 | #254 | Tragic 2.6% |
| Tsimshian | 0.3 /100 | #255 | Tragic 2.6% |
| Immigrants | Central America | 0.3 /100 | #256 | Tragic 2.6% |
| Potawatomi | 0.3 /100 | #257 | Tragic 2.6% |
| Immigrants | Nonimmigrants | 0.3 /100 | #258 | Tragic 2.6% |
Demographics Similar to Immigrants from Europe by Self-Care Disability
In terms of self-care disability, the demographic groups most similar to Immigrants from Europe are Nigerian (2.4%, a difference of 0.060%), Immigrants from Western Europe (2.4%, a difference of 0.060%), Immigrants from Italy (2.4%, a difference of 0.060%), Pakistani (2.4%, a difference of 0.11%), and Finnish (2.4%, a difference of 0.14%).
| Demographics | Rating | Rank | Self-Care Disability |
| Immigrants | Costa Rica | 75.1 /100 | #150 | Good 2.4% |
| Basques | 74.0 /100 | #151 | Good 2.4% |
| Tlingit-Haida | 73.5 /100 | #152 | Good 2.4% |
| Immigrants | England | 73.5 /100 | #153 | Good 2.4% |
| Italians | 72.2 /100 | #154 | Good 2.4% |
| Pakistanis | 71.4 /100 | #155 | Good 2.4% |
| Nigerians | 70.6 /100 | #156 | Good 2.4% |
| Immigrants | Europe | 69.6 /100 | #157 | Good 2.4% |
| Immigrants | Western Europe | 68.6 /100 | #158 | Good 2.4% |
| Immigrants | Italy | 68.5 /100 | #159 | Good 2.4% |
| Finns | 67.0 /100 | #160 | Good 2.4% |
| Lebanese | 66.5 /100 | #161 | Good 2.4% |
| Somalis | 63.7 /100 | #162 | Good 2.5% |
| German Russians | 62.7 /100 | #163 | Good 2.5% |
| Immigrants | Vietnam | 59.3 /100 | #164 | Average 2.5% |