Immigrants from West Indies vs Immigrants from Europe Unemployment Among Youth under 25 years
COMPARE
Immigrants from West Indies
Immigrants from Europe
Unemployment Among Youth under 25 years
Unemployment Among Youth under 25 years Comparison
Immigrants from West Indies
Immigrants from Europe
14.2%
UNEMPLOYMENT AMONG YOUTH UNDER 25 YEARS
0.0/ 100
METRIC RATING
310th/ 347
METRIC RANK
11.6%
UNEMPLOYMENT AMONG YOUTH UNDER 25 YEARS
42.4/ 100
METRIC RATING
178th/ 347
METRIC RANK
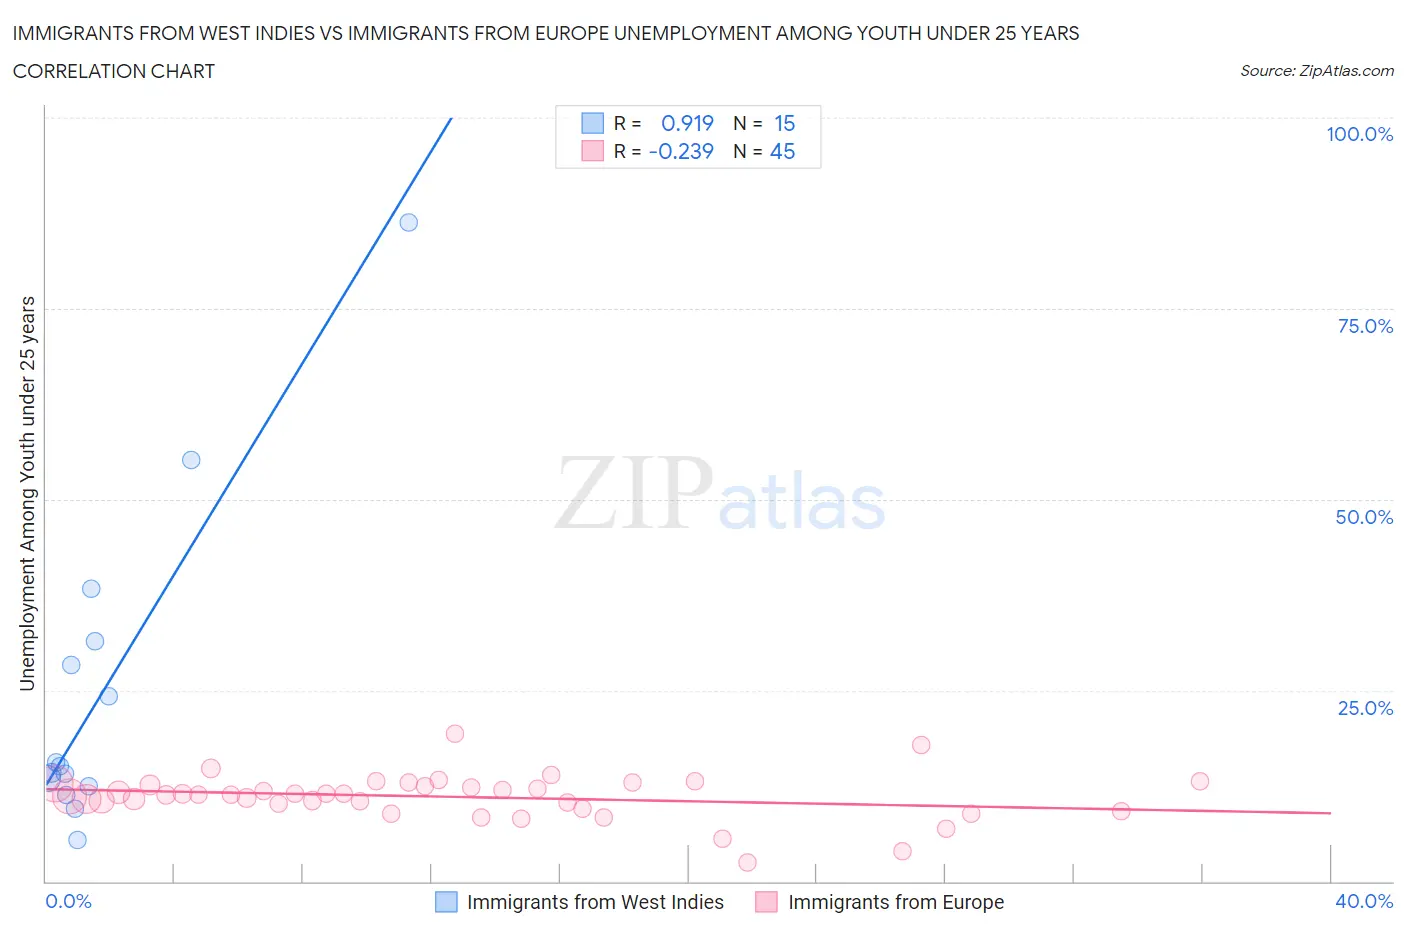
Immigrants from West Indies vs Immigrants from Europe Unemployment Among Youth under 25 years Correlation Chart
The statistical analysis conducted on geographies consisting of 72,363,085 people shows a near-perfect positive correlation between the proportion of Immigrants from West Indies and unemployment rate among youth under the age of 25 in the United States with a correlation coefficient (R) of 0.919 and weighted average of 14.2%. Similarly, the statistical analysis conducted on geographies consisting of 529,632,362 people shows a weak negative correlation between the proportion of Immigrants from Europe and unemployment rate among youth under the age of 25 in the United States with a correlation coefficient (R) of -0.239 and weighted average of 11.6%, a difference of 22.0%.
Unemployment Among Youth under 25 years Correlation Summary
| Measurement | Immigrants from West Indies | Immigrants from Europe |
| Minimum | 5.4% | 2.4% |
| Maximum | 86.2% | 19.3% |
| Range | 80.8% | 16.9% |
| Mean | 25.0% | 11.1% |
| Median | 15.0% | 11.3% |
| Interquartile 25% (IQ1) | 12.4% | 9.9% |
| Interquartile 75% (IQ3) | 31.5% | 12.7% |
| Interquartile Range (IQR) | 19.1% | 2.9% |
| Standard Deviation (Sample) | 21.4% | 3.0% |
| Standard Deviation (Population) | 20.7% | 2.9% |
Similar Demographics by Unemployment Among Youth under 25 years
Demographics Similar to Immigrants from West Indies by Unemployment Among Youth under 25 years
In terms of unemployment among youth under 25 years, the demographic groups most similar to Immigrants from West Indies are Immigrants from Bangladesh (14.2%, a difference of 0.030%), Vietnamese (14.3%, a difference of 0.34%), Aleut (14.1%, a difference of 0.54%), Immigrants from Armenia (14.4%, a difference of 1.2%), and Jamaican (14.4%, a difference of 1.3%).
| Demographics | Rating | Rank | Unemployment Among Youth under 25 years |
| Belizeans | 0.0 /100 | #303 | Tragic 13.8% |
| Houma | 0.0 /100 | #304 | Tragic 13.8% |
| Haitians | 0.0 /100 | #305 | Tragic 13.9% |
| Pueblo | 0.0 /100 | #306 | Tragic 13.9% |
| Immigrants | Haiti | 0.0 /100 | #307 | Tragic 14.0% |
| Immigrants | Belize | 0.0 /100 | #308 | Tragic 14.0% |
| Aleuts | 0.0 /100 | #309 | Tragic 14.1% |
| Immigrants | West Indies | 0.0 /100 | #310 | Tragic 14.2% |
| Immigrants | Bangladesh | 0.0 /100 | #311 | Tragic 14.2% |
| Vietnamese | 0.0 /100 | #312 | Tragic 14.3% |
| Immigrants | Armenia | 0.0 /100 | #313 | Tragic 14.4% |
| Jamaicans | 0.0 /100 | #314 | Tragic 14.4% |
| Sioux | 0.0 /100 | #315 | Tragic 14.4% |
| Natives/Alaskans | 0.0 /100 | #316 | Tragic 14.5% |
| Blacks/African Americans | 0.0 /100 | #317 | Tragic 14.5% |
Demographics Similar to Immigrants from Europe by Unemployment Among Youth under 25 years
In terms of unemployment among youth under 25 years, the demographic groups most similar to Immigrants from Europe are Immigrants from Hong Kong (11.6%, a difference of 0.0%), Immigrants from Denmark (11.6%, a difference of 0.11%), Spaniard (11.7%, a difference of 0.11%), Ugandan (11.6%, a difference of 0.13%), and Syrian (11.7%, a difference of 0.17%).
| Demographics | Rating | Rank | Unemployment Among Youth under 25 years |
| Bangladeshis | 55.6 /100 | #171 | Average 11.6% |
| Immigrants | Morocco | 55.1 /100 | #172 | Average 11.6% |
| Immigrants | South Eastern Asia | 51.7 /100 | #173 | Average 11.6% |
| Immigrants | China | 50.0 /100 | #174 | Average 11.6% |
| Immigrants | Iraq | 47.0 /100 | #175 | Average 11.6% |
| Ugandans | 45.6 /100 | #176 | Average 11.6% |
| Immigrants | Denmark | 45.0 /100 | #177 | Average 11.6% |
| Immigrants | Europe | 42.4 /100 | #178 | Average 11.6% |
| Immigrants | Hong Kong | 42.4 /100 | #179 | Average 11.6% |
| Spaniards | 39.8 /100 | #180 | Fair 11.7% |
| Syrians | 38.4 /100 | #181 | Fair 11.7% |
| Immigrants | Italy | 36.2 /100 | #182 | Fair 11.7% |
| Americans | 34.5 /100 | #183 | Fair 11.7% |
| Immigrants | Eastern Europe | 34.1 /100 | #184 | Fair 11.7% |
| French American Indians | 34.0 /100 | #185 | Fair 11.7% |