Immigrants from Turkey vs Immigrants from Somalia Self-Care Disability
COMPARE
Immigrants from Turkey
Immigrants from Somalia
Self-Care Disability
Self-Care Disability Comparison
Immigrants from Turkey
Immigrants from Somalia
2.3%
SELF-CARE DISABILITY
99.9/ 100
METRIC RATING
34th/ 347
METRIC RANK
2.5%
SELF-CARE DISABILITY
55.9/ 100
METRIC RATING
169th/ 347
METRIC RANK
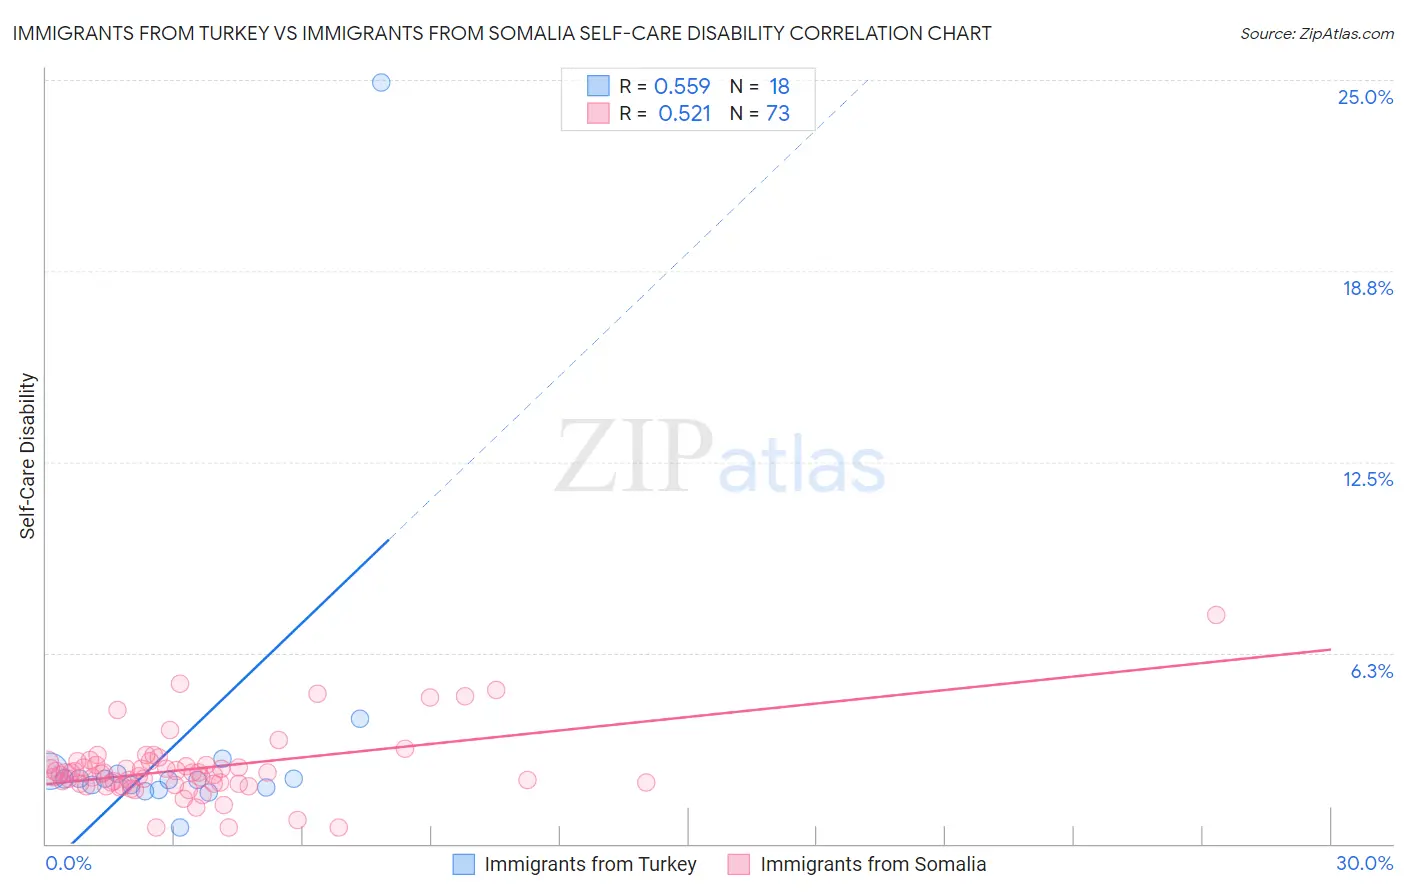
Immigrants from Turkey vs Immigrants from Somalia Self-Care Disability Correlation Chart
The statistical analysis conducted on geographies consisting of 222,915,047 people shows a substantial positive correlation between the proportion of Immigrants from Turkey and percentage of population with self-care disability in the United States with a correlation coefficient (R) of 0.559 and weighted average of 2.3%. Similarly, the statistical analysis conducted on geographies consisting of 92,092,115 people shows a substantial positive correlation between the proportion of Immigrants from Somalia and percentage of population with self-care disability in the United States with a correlation coefficient (R) of 0.521 and weighted average of 2.5%, a difference of 8.6%.
Self-Care Disability Correlation Summary
| Measurement | Immigrants from Turkey | Immigrants from Somalia |
| Minimum | 0.52% | 0.52% |
| Maximum | 24.9% | 7.5% |
| Range | 24.4% | 6.9% |
| Mean | 3.4% | 2.5% |
| Median | 2.1% | 2.3% |
| Interquartile 25% (IQ1) | 1.8% | 2.0% |
| Interquartile 75% (IQ3) | 2.3% | 2.6% |
| Interquartile Range (IQR) | 0.47% | 0.66% |
| Standard Deviation (Sample) | 5.4% | 1.1% |
| Standard Deviation (Population) | 5.3% | 1.1% |
Similar Demographics by Self-Care Disability
Demographics Similar to Immigrants from Turkey by Self-Care Disability
In terms of self-care disability, the demographic groups most similar to Immigrants from Turkey are Immigrants from Korea (2.3%, a difference of 0.060%), Immigrants from Australia (2.3%, a difference of 0.060%), Immigrants from Lithuania (2.3%, a difference of 0.070%), Immigrants from Sweden (2.3%, a difference of 0.24%), and Burmese (2.3%, a difference of 0.29%).
| Demographics | Rating | Rank | Self-Care Disability |
| Venezuelans | 99.9 /100 | #27 | Exceptional 2.2% |
| Inupiat | 99.9 /100 | #28 | Exceptional 2.2% |
| Immigrants | Zimbabwe | 99.9 /100 | #29 | Exceptional 2.3% |
| Paraguayans | 99.9 /100 | #30 | Exceptional 2.3% |
| Danes | 99.9 /100 | #31 | Exceptional 2.3% |
| Burmese | 99.9 /100 | #32 | Exceptional 2.3% |
| Immigrants | Korea | 99.9 /100 | #33 | Exceptional 2.3% |
| Immigrants | Turkey | 99.9 /100 | #34 | Exceptional 2.3% |
| Immigrants | Australia | 99.9 /100 | #35 | Exceptional 2.3% |
| Immigrants | Lithuania | 99.9 /100 | #36 | Exceptional 2.3% |
| Immigrants | Sweden | 99.9 /100 | #37 | Exceptional 2.3% |
| Immigrants | Eastern Africa | 99.9 /100 | #38 | Exceptional 2.3% |
| Immigrants | Bulgaria | 99.8 /100 | #39 | Exceptional 2.3% |
| Iranians | 99.8 /100 | #40 | Exceptional 2.3% |
| Immigrants | Sudan | 99.8 /100 | #41 | Exceptional 2.3% |
Demographics Similar to Immigrants from Somalia by Self-Care Disability
In terms of self-care disability, the demographic groups most similar to Immigrants from Somalia are Ute (2.5%, a difference of 0.060%), Immigrants from Greece (2.5%, a difference of 0.070%), Scottish (2.5%, a difference of 0.080%), Pennsylvania German (2.5%, a difference of 0.11%), and Czechoslovakian (2.5%, a difference of 0.12%).
| Demographics | Rating | Rank | Self-Care Disability |
| Somalis | 63.7 /100 | #162 | Good 2.5% |
| German Russians | 62.7 /100 | #163 | Good 2.5% |
| Immigrants | Vietnam | 59.3 /100 | #164 | Average 2.5% |
| Syrians | 59.0 /100 | #165 | Average 2.5% |
| Canadians | 58.8 /100 | #166 | Average 2.5% |
| Immigrants | Greece | 57.3 /100 | #167 | Average 2.5% |
| Ute | 57.1 /100 | #168 | Average 2.5% |
| Immigrants | Somalia | 55.9 /100 | #169 | Average 2.5% |
| Scottish | 54.3 /100 | #170 | Average 2.5% |
| Pennsylvania Germans | 53.5 /100 | #171 | Average 2.5% |
| Czechoslovakians | 53.5 /100 | #172 | Average 2.5% |
| Immigrants | Burma/Myanmar | 52.8 /100 | #173 | Average 2.5% |
| Welsh | 50.0 /100 | #174 | Average 2.5% |
| Immigrants | Bosnia and Herzegovina | 49.6 /100 | #175 | Average 2.5% |
| Immigrants | Afghanistan | 47.6 /100 | #176 | Average 2.5% |