Immigrants from Turkey vs Immigrants from Uzbekistan Disability Age Under 5
COMPARE
Immigrants from Turkey
Immigrants from Uzbekistan
Disability Age Under 5
Disability Age Under 5 Comparison
Immigrants from Turkey
Immigrants from Uzbekistan
1.1%
DISABILITY AGE UNDER 5
99.8/ 100
METRIC RATING
45th/ 347
METRIC RANK
0.85%
DISABILITY AGE UNDER 5
100.0/ 100
METRIC RATING
4th/ 347
METRIC RANK
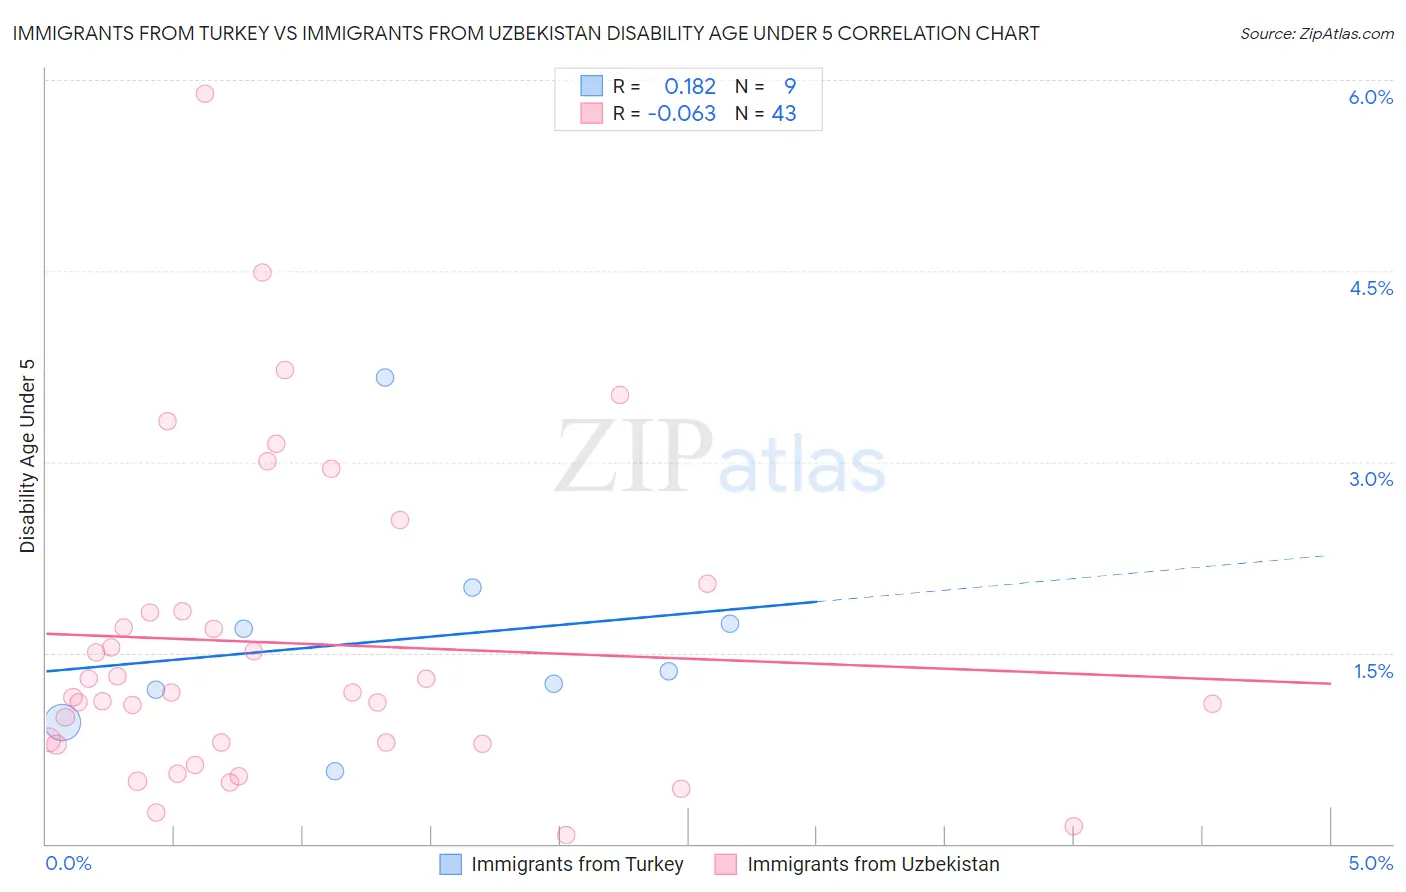
Immigrants from Turkey vs Immigrants from Uzbekistan Disability Age Under 5 Correlation Chart
The statistical analysis conducted on geographies consisting of 138,836,268 people shows a poor positive correlation between the proportion of Immigrants from Turkey and percentage of population with a disability under the age of 5 in the United States with a correlation coefficient (R) of 0.182 and weighted average of 1.1%. Similarly, the statistical analysis conducted on geographies consisting of 86,983,125 people shows a slight negative correlation between the proportion of Immigrants from Uzbekistan and percentage of population with a disability under the age of 5 in the United States with a correlation coefficient (R) of -0.063 and weighted average of 0.85%, a difference of 25.3%.
Disability Age Under 5 Correlation Summary
| Measurement | Immigrants from Turkey | Immigrants from Uzbekistan |
| Minimum | 0.57% | 0.069% |
| Maximum | 3.7% | 5.9% |
| Range | 3.1% | 5.8% |
| Mean | 1.6% | 1.6% |
| Median | 1.4% | 1.2% |
| Interquartile 25% (IQ1) | 1.1% | 0.79% |
| Interquartile 75% (IQ3) | 1.9% | 1.8% |
| Interquartile Range (IQR) | 0.79% | 1.0% |
| Standard Deviation (Sample) | 0.89% | 1.2% |
| Standard Deviation (Population) | 0.83% | 1.2% |
Similar Demographics by Disability Age Under 5
Demographics Similar to Immigrants from Turkey by Disability Age Under 5
In terms of disability age under 5, the demographic groups most similar to Immigrants from Turkey are Immigrants from Asia (1.1%, a difference of 0.22%), Pima (1.1%, a difference of 0.32%), Immigrants from Bulgaria (1.1%, a difference of 0.33%), Immigrants from Congo (1.1%, a difference of 0.40%), and Thai (1.1%, a difference of 0.43%).
| Demographics | Rating | Rank | Disability Age Under 5 |
| Immigrants | Guyana | 99.9 /100 | #38 | Exceptional 1.0% |
| Filipinos | 99.9 /100 | #39 | Exceptional 1.1% |
| Immigrants | Albania | 99.9 /100 | #40 | Exceptional 1.1% |
| Thais | 99.8 /100 | #41 | Exceptional 1.1% |
| Immigrants | Bulgaria | 99.8 /100 | #42 | Exceptional 1.1% |
| Pima | 99.8 /100 | #43 | Exceptional 1.1% |
| Immigrants | Asia | 99.8 /100 | #44 | Exceptional 1.1% |
| Immigrants | Turkey | 99.8 /100 | #45 | Exceptional 1.1% |
| Immigrants | Congo | 99.8 /100 | #46 | Exceptional 1.1% |
| Immigrants | Sweden | 99.8 /100 | #47 | Exceptional 1.1% |
| Immigrants | Singapore | 99.7 /100 | #48 | Exceptional 1.1% |
| Immigrants | Russia | 99.7 /100 | #49 | Exceptional 1.1% |
| Immigrants | Japan | 99.7 /100 | #50 | Exceptional 1.1% |
| Immigrants | Kazakhstan | 99.7 /100 | #51 | Exceptional 1.1% |
| Immigrants | Bolivia | 99.6 /100 | #52 | Exceptional 1.1% |
Demographics Similar to Immigrants from Uzbekistan by Disability Age Under 5
In terms of disability age under 5, the demographic groups most similar to Immigrants from Uzbekistan are Immigrants from Bangladesh (0.85%, a difference of 0.41%), Ute (0.86%, a difference of 1.3%), Vietnamese (0.81%, a difference of 4.6%), Immigrants from Afghanistan (0.91%, a difference of 6.7%), and Immigrants from Yemen (0.91%, a difference of 6.9%).
| Demographics | Rating | Rank | Disability Age Under 5 |
| Immigrants | Armenia | 100.0 /100 | #1 | Exceptional 0.76% |
| Immigrants | St. Vincent and the Grenadines | 100.0 /100 | #2 | Exceptional 0.79% |
| Vietnamese | 100.0 /100 | #3 | Exceptional 0.81% |
| Immigrants | Uzbekistan | 100.0 /100 | #4 | Exceptional 0.85% |
| Immigrants | Bangladesh | 100.0 /100 | #5 | Exceptional 0.85% |
| Ute | 100.0 /100 | #6 | Exceptional 0.86% |
| Immigrants | Afghanistan | 100.0 /100 | #7 | Exceptional 0.91% |
| Immigrants | Yemen | 100.0 /100 | #8 | Exceptional 0.91% |
| Immigrants | Fiji | 100.0 /100 | #9 | Exceptional 0.92% |
| Marshallese | 100.0 /100 | #10 | Exceptional 0.94% |
| Afghans | 100.0 /100 | #11 | Exceptional 0.94% |
| Immigrants | Grenada | 100.0 /100 | #12 | Exceptional 0.94% |
| Soviet Union | 100.0 /100 | #13 | Exceptional 0.95% |
| Yuman | 100.0 /100 | #14 | Exceptional 0.95% |
| Immigrants | Hong Kong | 100.0 /100 | #15 | Exceptional 0.95% |