Immigrants from Turkey vs Immigrants Disability Age Under 5
COMPARE
Immigrants from Turkey
Immigrants
Disability Age Under 5
Disability Age Under 5 Comparison
Immigrants from Turkey
Immigrants
1.1%
DISABILITY AGE UNDER 5
99.8/ 100
METRIC RATING
45th/ 347
METRIC RANK
1.2%
DISABILITY AGE UNDER 5
88.0/ 100
METRIC RATING
129th/ 347
METRIC RANK
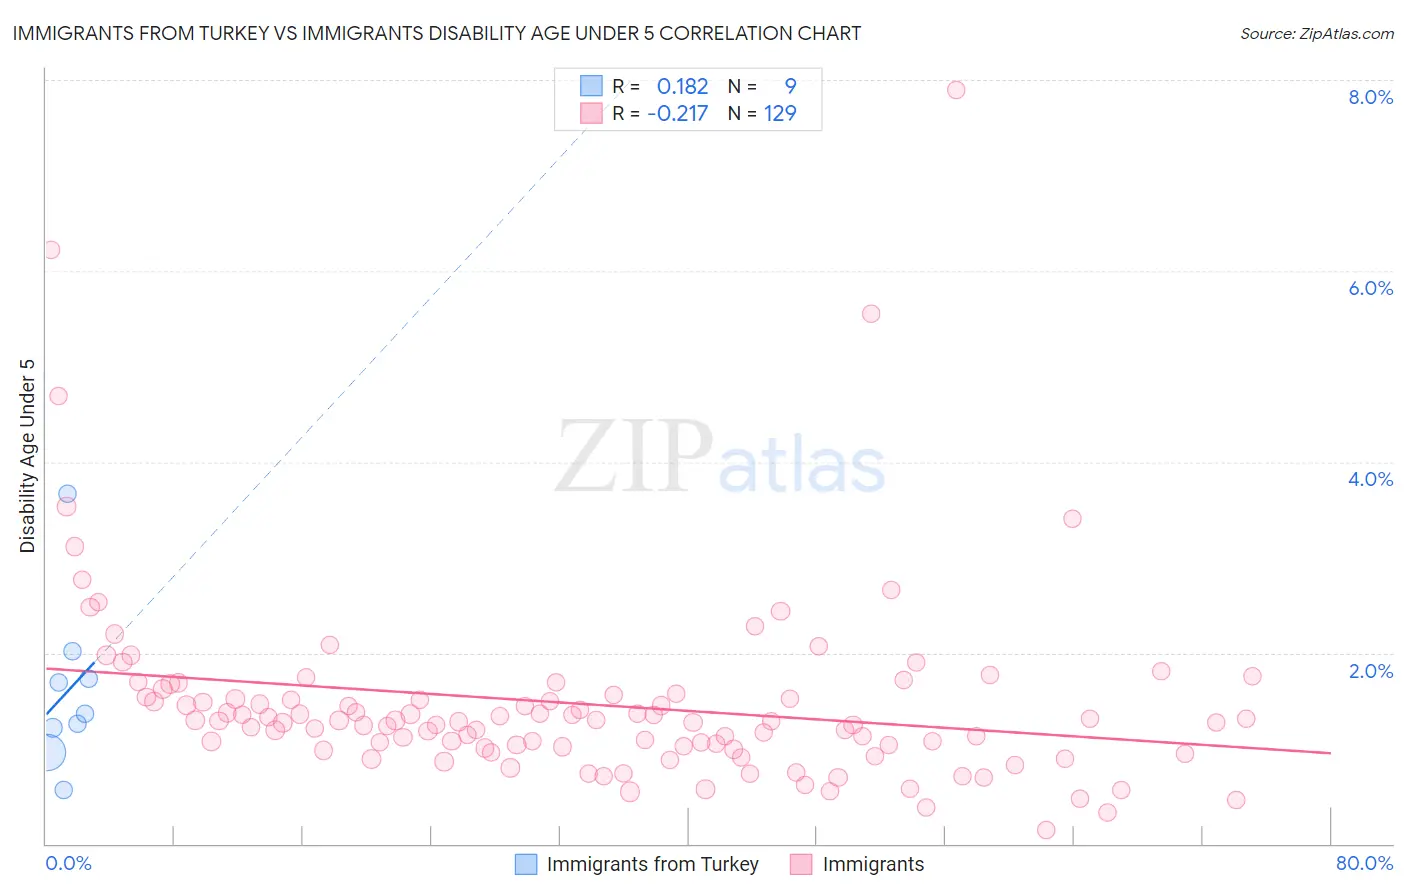
Immigrants from Turkey vs Immigrants Disability Age Under 5 Correlation Chart
The statistical analysis conducted on geographies consisting of 138,836,268 people shows a poor positive correlation between the proportion of Immigrants from Turkey and percentage of population with a disability under the age of 5 in the United States with a correlation coefficient (R) of 0.182 and weighted average of 1.1%. Similarly, the statistical analysis conducted on geographies consisting of 262,190,696 people shows a weak negative correlation between the proportion of Immigrants and percentage of population with a disability under the age of 5 in the United States with a correlation coefficient (R) of -0.217 and weighted average of 1.2%, a difference of 11.2%.
Disability Age Under 5 Correlation Summary
| Measurement | Immigrants from Turkey | Immigrants |
| Minimum | 0.57% | 0.14% |
| Maximum | 3.7% | 7.9% |
| Range | 3.1% | 7.8% |
| Mean | 1.6% | 1.5% |
| Median | 1.4% | 1.3% |
| Interquartile 25% (IQ1) | 1.1% | 1.0% |
| Interquartile 75% (IQ3) | 1.9% | 1.5% |
| Interquartile Range (IQR) | 0.79% | 0.54% |
| Standard Deviation (Sample) | 0.89% | 1.0% |
| Standard Deviation (Population) | 0.83% | 1.0% |
Similar Demographics by Disability Age Under 5
Demographics Similar to Immigrants from Turkey by Disability Age Under 5
In terms of disability age under 5, the demographic groups most similar to Immigrants from Turkey are Immigrants from Asia (1.1%, a difference of 0.22%), Pima (1.1%, a difference of 0.32%), Immigrants from Bulgaria (1.1%, a difference of 0.33%), Immigrants from Congo (1.1%, a difference of 0.40%), and Thai (1.1%, a difference of 0.43%).
| Demographics | Rating | Rank | Disability Age Under 5 |
| Immigrants | Guyana | 99.9 /100 | #38 | Exceptional 1.0% |
| Filipinos | 99.9 /100 | #39 | Exceptional 1.1% |
| Immigrants | Albania | 99.9 /100 | #40 | Exceptional 1.1% |
| Thais | 99.8 /100 | #41 | Exceptional 1.1% |
| Immigrants | Bulgaria | 99.8 /100 | #42 | Exceptional 1.1% |
| Pima | 99.8 /100 | #43 | Exceptional 1.1% |
| Immigrants | Asia | 99.8 /100 | #44 | Exceptional 1.1% |
| Immigrants | Turkey | 99.8 /100 | #45 | Exceptional 1.1% |
| Immigrants | Congo | 99.8 /100 | #46 | Exceptional 1.1% |
| Immigrants | Sweden | 99.8 /100 | #47 | Exceptional 1.1% |
| Immigrants | Singapore | 99.7 /100 | #48 | Exceptional 1.1% |
| Immigrants | Russia | 99.7 /100 | #49 | Exceptional 1.1% |
| Immigrants | Japan | 99.7 /100 | #50 | Exceptional 1.1% |
| Immigrants | Kazakhstan | 99.7 /100 | #51 | Exceptional 1.1% |
| Immigrants | Bolivia | 99.6 /100 | #52 | Exceptional 1.1% |
Demographics Similar to Immigrants by Disability Age Under 5
In terms of disability age under 5, the demographic groups most similar to Immigrants are Korean (1.2%, a difference of 0.080%), Immigrants from Romania (1.2%, a difference of 0.090%), Immigrants from France (1.2%, a difference of 0.090%), Immigrants from Serbia (1.2%, a difference of 0.090%), and Immigrants from Eastern Europe (1.2%, a difference of 0.16%).
| Demographics | Rating | Rank | Disability Age Under 5 |
| Aleuts | 90.7 /100 | #122 | Exceptional 1.2% |
| Zimbabweans | 90.6 /100 | #123 | Exceptional 1.2% |
| Immigrants | Cambodia | 90.5 /100 | #124 | Exceptional 1.2% |
| Japanese | 90.3 /100 | #125 | Exceptional 1.2% |
| Central Americans | 89.7 /100 | #126 | Excellent 1.2% |
| Immigrants | Romania | 88.4 /100 | #127 | Excellent 1.2% |
| Immigrants | France | 88.4 /100 | #128 | Excellent 1.2% |
| Immigrants | Immigrants | 88.0 /100 | #129 | Excellent 1.2% |
| Koreans | 87.7 /100 | #130 | Excellent 1.2% |
| Immigrants | Serbia | 87.6 /100 | #131 | Excellent 1.2% |
| Immigrants | Eastern Europe | 87.3 /100 | #132 | Excellent 1.2% |
| Immigrants | Spain | 86.5 /100 | #133 | Excellent 1.2% |
| Argentineans | 85.7 /100 | #134 | Excellent 1.2% |
| Fijians | 84.7 /100 | #135 | Excellent 1.2% |
| Moroccans | 83.6 /100 | #136 | Excellent 1.2% |