Immigrants from Turkey vs Canadian Disability
COMPARE
Immigrants from Turkey
Canadian
Disability
Disability Comparison
Immigrants from Turkey
Canadians
10.6%
DISABILITY
100.0/ 100
METRIC RATING
30th/ 347
METRIC RANK
12.4%
DISABILITY
0.4/ 100
METRIC RATING
259th/ 347
METRIC RANK
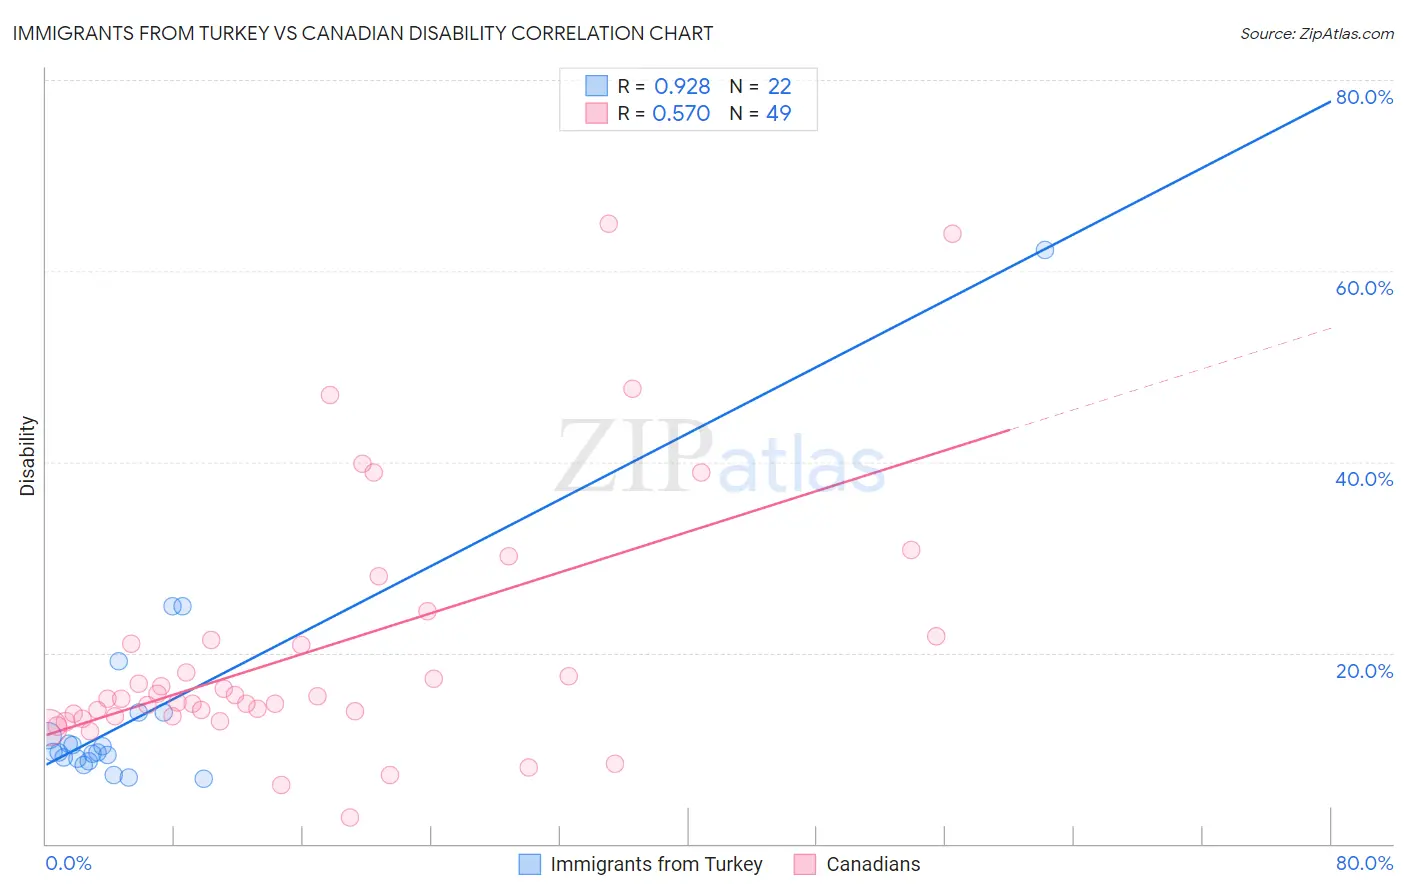
Immigrants from Turkey vs Canadian Disability Correlation Chart
The statistical analysis conducted on geographies consisting of 223,052,845 people shows a near-perfect positive correlation between the proportion of Immigrants from Turkey and percentage of population with a disability in the United States with a correlation coefficient (R) of 0.928 and weighted average of 10.6%. Similarly, the statistical analysis conducted on geographies consisting of 437,501,505 people shows a substantial positive correlation between the proportion of Canadians and percentage of population with a disability in the United States with a correlation coefficient (R) of 0.570 and weighted average of 12.4%, a difference of 16.7%.
Disability Correlation Summary
| Measurement | Immigrants from Turkey | Canadian |
| Minimum | 6.9% | 2.8% |
| Maximum | 62.2% | 65.0% |
| Range | 55.3% | 62.2% |
| Mean | 13.8% | 20.3% |
| Median | 9.6% | 15.2% |
| Interquartile 25% (IQ1) | 8.9% | 13.4% |
| Interquartile 75% (IQ3) | 13.8% | 21.6% |
| Interquartile Range (IQR) | 4.8% | 8.2% |
| Standard Deviation (Sample) | 11.9% | 13.5% |
| Standard Deviation (Population) | 11.7% | 13.3% |
Similar Demographics by Disability
Demographics Similar to Immigrants from Turkey by Disability
In terms of disability, the demographic groups most similar to Immigrants from Turkey are Immigrants from Egypt (10.6%, a difference of 0.070%), Immigrants from Argentina (10.6%, a difference of 0.15%), Paraguayan (10.6%, a difference of 0.17%), Egyptian (10.6%, a difference of 0.28%), and Cypriot (10.6%, a difference of 0.41%).
| Demographics | Rating | Rank | Disability |
| Immigrants | Asia | 100.0 /100 | #23 | Exceptional 10.5% |
| Venezuelans | 100.0 /100 | #24 | Exceptional 10.5% |
| Immigrants | Malaysia | 100.0 /100 | #25 | Exceptional 10.6% |
| Argentineans | 100.0 /100 | #26 | Exceptional 10.6% |
| Cypriots | 100.0 /100 | #27 | Exceptional 10.6% |
| Egyptians | 100.0 /100 | #28 | Exceptional 10.6% |
| Immigrants | Argentina | 100.0 /100 | #29 | Exceptional 10.6% |
| Immigrants | Turkey | 100.0 /100 | #30 | Exceptional 10.6% |
| Immigrants | Egypt | 100.0 /100 | #31 | Exceptional 10.6% |
| Paraguayans | 100.0 /100 | #32 | Exceptional 10.6% |
| Immigrants | Kuwait | 100.0 /100 | #33 | Exceptional 10.7% |
| Immigrants | Ethiopia | 100.0 /100 | #34 | Exceptional 10.7% |
| Immigrants | Indonesia | 100.0 /100 | #35 | Exceptional 10.7% |
| Ethiopians | 100.0 /100 | #36 | Exceptional 10.7% |
| Turks | 100.0 /100 | #37 | Exceptional 10.7% |
Demographics Similar to Canadians by Disability
In terms of disability, the demographic groups most similar to Canadians are Immigrants from Liberia (12.4%, a difference of 0.030%), Slavic (12.4%, a difference of 0.060%), Scandinavian (12.4%, a difference of 0.10%), Immigrants from Laos (12.4%, a difference of 0.20%), and Immigrants from Dominica (12.4%, a difference of 0.29%).
| Demographics | Rating | Rank | Disability |
| Bermudans | 1.1 /100 | #252 | Tragic 12.3% |
| Belgians | 0.8 /100 | #253 | Tragic 12.3% |
| German Russians | 0.8 /100 | #254 | Tragic 12.3% |
| Slovenes | 0.6 /100 | #255 | Tragic 12.4% |
| Immigrants | Dominica | 0.6 /100 | #256 | Tragic 12.4% |
| Immigrants | Laos | 0.5 /100 | #257 | Tragic 12.4% |
| Slavs | 0.5 /100 | #258 | Tragic 12.4% |
| Canadians | 0.4 /100 | #259 | Tragic 12.4% |
| Immigrants | Liberia | 0.4 /100 | #260 | Tragic 12.4% |
| Scandinavians | 0.4 /100 | #261 | Tragic 12.4% |
| Native Hawaiians | 0.3 /100 | #262 | Tragic 12.5% |
| Hawaiians | 0.2 /100 | #263 | Tragic 12.5% |
| Immigrants | Germany | 0.2 /100 | #264 | Tragic 12.5% |
| U.S. Virgin Islanders | 0.2 /100 | #265 | Tragic 12.5% |
| Czechoslovakians | 0.2 /100 | #266 | Tragic 12.5% |