Mexican American Indian vs Canadian Disability
COMPARE
Mexican American Indian
Canadian
Disability
Disability Comparison
Mexican American Indians
Canadians
12.0%
DISABILITY
11.4/ 100
METRIC RATING
204th/ 347
METRIC RANK
12.4%
DISABILITY
0.4/ 100
METRIC RATING
259th/ 347
METRIC RANK
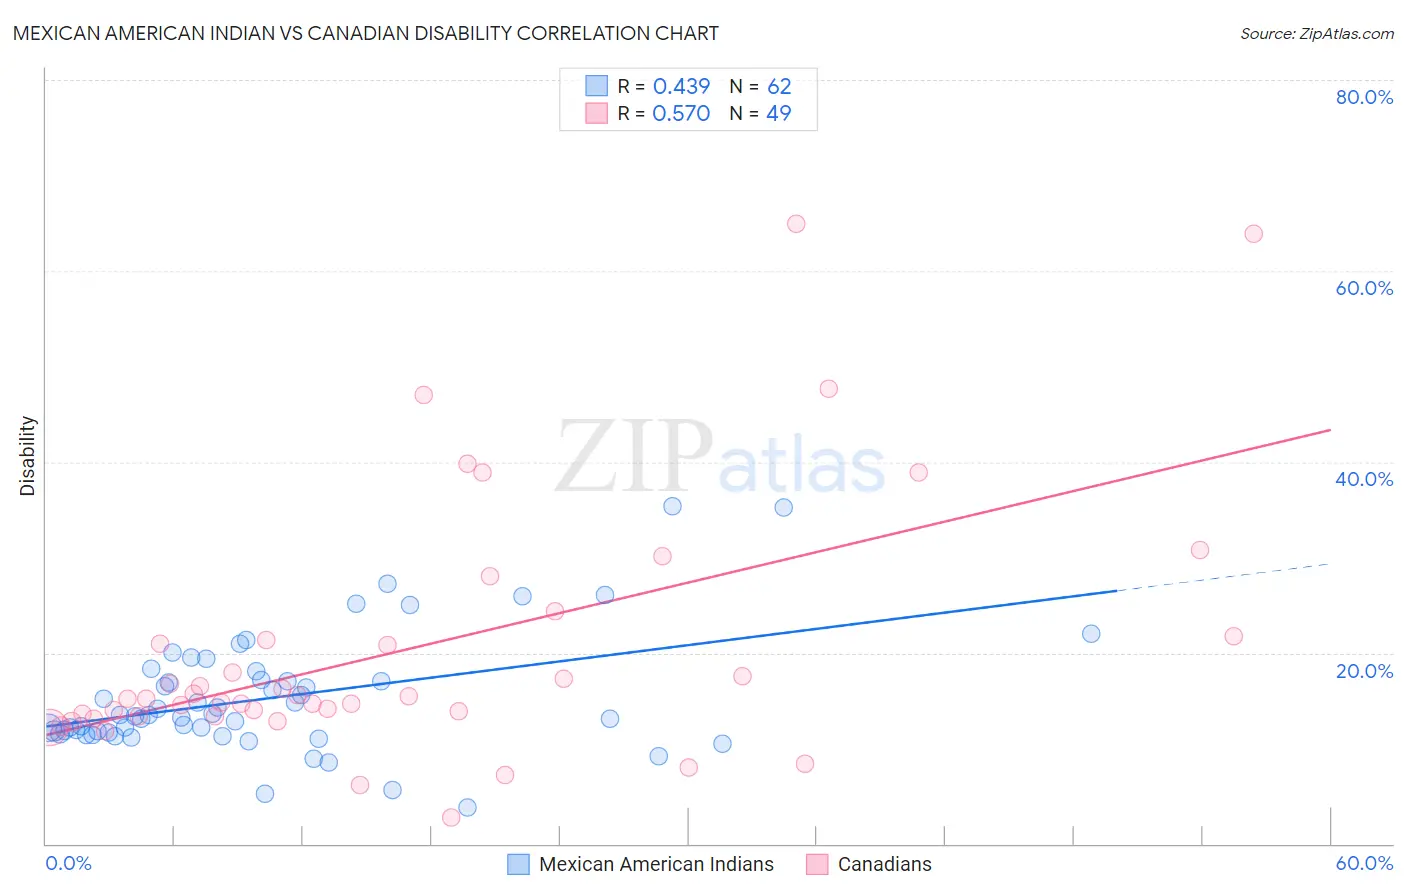
Mexican American Indian vs Canadian Disability Correlation Chart
The statistical analysis conducted on geographies consisting of 317,572,347 people shows a moderate positive correlation between the proportion of Mexican American Indians and percentage of population with a disability in the United States with a correlation coefficient (R) of 0.439 and weighted average of 12.0%. Similarly, the statistical analysis conducted on geographies consisting of 437,501,505 people shows a substantial positive correlation between the proportion of Canadians and percentage of population with a disability in the United States with a correlation coefficient (R) of 0.570 and weighted average of 12.4%, a difference of 3.7%.
Disability Correlation Summary
| Measurement | Mexican American Indian | Canadian |
| Minimum | 3.8% | 2.8% |
| Maximum | 35.4% | 65.0% |
| Range | 31.6% | 62.2% |
| Mean | 15.3% | 20.3% |
| Median | 13.4% | 15.2% |
| Interquartile 25% (IQ1) | 11.6% | 13.4% |
| Interquartile 75% (IQ3) | 17.2% | 21.6% |
| Interquartile Range (IQR) | 5.6% | 8.2% |
| Standard Deviation (Sample) | 6.2% | 13.5% |
| Standard Deviation (Population) | 6.1% | 13.3% |
Similar Demographics by Disability
Demographics Similar to Mexican American Indians by Disability
In terms of disability, the demographic groups most similar to Mexican American Indians are British West Indian (12.0%, a difference of 0.0%), Immigrants from England (12.0%, a difference of 0.050%), Assyrian/Chaldean/Syriac (11.9%, a difference of 0.12%), Belizean (11.9%, a difference of 0.14%), and Immigrants from Western Europe (12.0%, a difference of 0.16%).
| Demographics | Rating | Rank | Disability |
| Immigrants | Belize | 15.2 /100 | #197 | Poor 11.9% |
| Ukrainians | 14.7 /100 | #198 | Poor 11.9% |
| Immigrants | Panama | 14.6 /100 | #199 | Poor 11.9% |
| Belizeans | 12.8 /100 | #200 | Poor 11.9% |
| Assyrians/Chaldeans/Syriacs | 12.6 /100 | #201 | Poor 11.9% |
| Immigrants | England | 12.0 /100 | #202 | Poor 12.0% |
| British West Indians | 11.5 /100 | #203 | Poor 12.0% |
| Mexican American Indians | 11.4 /100 | #204 | Poor 12.0% |
| Immigrants | Western Europe | 10.1 /100 | #205 | Poor 12.0% |
| Immigrants | Senegal | 9.4 /100 | #206 | Tragic 12.0% |
| Immigrants | Thailand | 9.3 /100 | #207 | Tragic 12.0% |
| Immigrants | Caribbean | 9.1 /100 | #208 | Tragic 12.0% |
| Danes | 8.7 /100 | #209 | Tragic 12.0% |
| Czechs | 7.9 /100 | #210 | Tragic 12.0% |
| Immigrants | Cambodia | 7.3 /100 | #211 | Tragic 12.0% |
Demographics Similar to Canadians by Disability
In terms of disability, the demographic groups most similar to Canadians are Immigrants from Liberia (12.4%, a difference of 0.030%), Slavic (12.4%, a difference of 0.060%), Scandinavian (12.4%, a difference of 0.10%), Immigrants from Laos (12.4%, a difference of 0.20%), and Immigrants from Dominica (12.4%, a difference of 0.29%).
| Demographics | Rating | Rank | Disability |
| Bermudans | 1.1 /100 | #252 | Tragic 12.3% |
| Belgians | 0.8 /100 | #253 | Tragic 12.3% |
| German Russians | 0.8 /100 | #254 | Tragic 12.3% |
| Slovenes | 0.6 /100 | #255 | Tragic 12.4% |
| Immigrants | Dominica | 0.6 /100 | #256 | Tragic 12.4% |
| Immigrants | Laos | 0.5 /100 | #257 | Tragic 12.4% |
| Slavs | 0.5 /100 | #258 | Tragic 12.4% |
| Canadians | 0.4 /100 | #259 | Tragic 12.4% |
| Immigrants | Liberia | 0.4 /100 | #260 | Tragic 12.4% |
| Scandinavians | 0.4 /100 | #261 | Tragic 12.4% |
| Native Hawaiians | 0.3 /100 | #262 | Tragic 12.5% |
| Hawaiians | 0.2 /100 | #263 | Tragic 12.5% |
| Immigrants | Germany | 0.2 /100 | #264 | Tragic 12.5% |
| U.S. Virgin Islanders | 0.2 /100 | #265 | Tragic 12.5% |
| Czechoslovakians | 0.2 /100 | #266 | Tragic 12.5% |