Immigrants from Turkey vs Immigrants from Spain Disability
COMPARE
Immigrants from Turkey
Immigrants from Spain
Disability
Disability Comparison
Immigrants from Turkey
Immigrants from Spain
10.6%
DISABILITY
100.0/ 100
METRIC RATING
30th/ 347
METRIC RANK
10.9%
DISABILITY
99.8/ 100
METRIC RATING
53rd/ 347
METRIC RANK
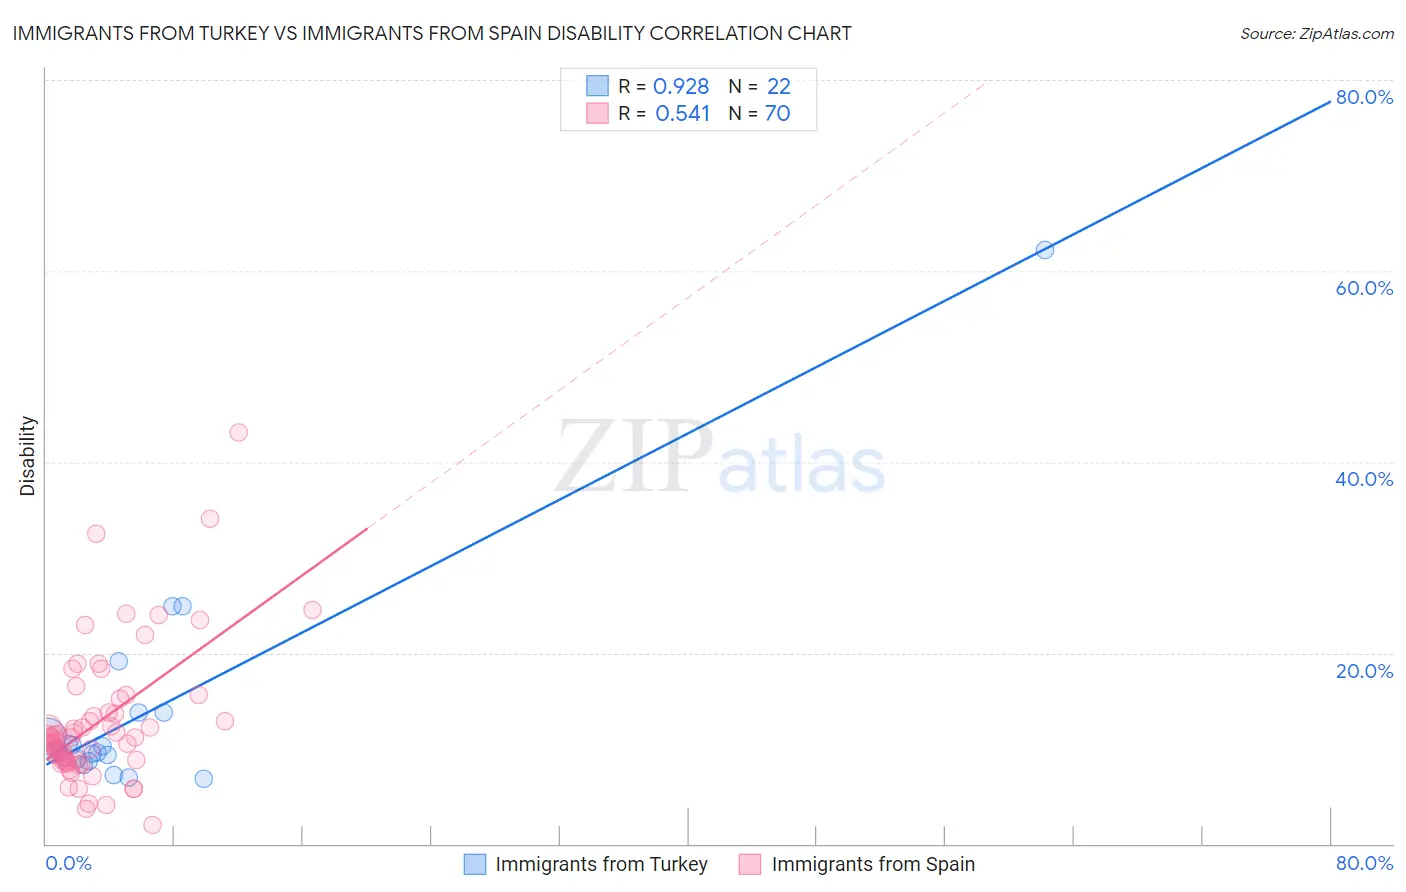
Immigrants from Turkey vs Immigrants from Spain Disability Correlation Chart
The statistical analysis conducted on geographies consisting of 223,052,845 people shows a near-perfect positive correlation between the proportion of Immigrants from Turkey and percentage of population with a disability in the United States with a correlation coefficient (R) of 0.928 and weighted average of 10.6%. Similarly, the statistical analysis conducted on geographies consisting of 239,685,180 people shows a substantial positive correlation between the proportion of Immigrants from Spain and percentage of population with a disability in the United States with a correlation coefficient (R) of 0.541 and weighted average of 10.9%, a difference of 2.2%.
Disability Correlation Summary
| Measurement | Immigrants from Turkey | Immigrants from Spain |
| Minimum | 6.9% | 1.9% |
| Maximum | 62.2% | 43.1% |
| Range | 55.3% | 41.2% |
| Mean | 13.8% | 12.7% |
| Median | 9.6% | 11.0% |
| Interquartile 25% (IQ1) | 8.9% | 8.7% |
| Interquartile 75% (IQ3) | 13.8% | 13.8% |
| Interquartile Range (IQR) | 4.8% | 5.1% |
| Standard Deviation (Sample) | 11.9% | 7.2% |
| Standard Deviation (Population) | 11.7% | 7.1% |
Similar Demographics by Disability
Demographics Similar to Immigrants from Turkey by Disability
In terms of disability, the demographic groups most similar to Immigrants from Turkey are Immigrants from Egypt (10.6%, a difference of 0.070%), Immigrants from Argentina (10.6%, a difference of 0.15%), Paraguayan (10.6%, a difference of 0.17%), Egyptian (10.6%, a difference of 0.28%), and Cypriot (10.6%, a difference of 0.41%).
| Demographics | Rating | Rank | Disability |
| Immigrants | Asia | 100.0 /100 | #23 | Exceptional 10.5% |
| Venezuelans | 100.0 /100 | #24 | Exceptional 10.5% |
| Immigrants | Malaysia | 100.0 /100 | #25 | Exceptional 10.6% |
| Argentineans | 100.0 /100 | #26 | Exceptional 10.6% |
| Cypriots | 100.0 /100 | #27 | Exceptional 10.6% |
| Egyptians | 100.0 /100 | #28 | Exceptional 10.6% |
| Immigrants | Argentina | 100.0 /100 | #29 | Exceptional 10.6% |
| Immigrants | Turkey | 100.0 /100 | #30 | Exceptional 10.6% |
| Immigrants | Egypt | 100.0 /100 | #31 | Exceptional 10.6% |
| Paraguayans | 100.0 /100 | #32 | Exceptional 10.6% |
| Immigrants | Kuwait | 100.0 /100 | #33 | Exceptional 10.7% |
| Immigrants | Ethiopia | 100.0 /100 | #34 | Exceptional 10.7% |
| Immigrants | Indonesia | 100.0 /100 | #35 | Exceptional 10.7% |
| Ethiopians | 100.0 /100 | #36 | Exceptional 10.7% |
| Turks | 100.0 /100 | #37 | Exceptional 10.7% |
Demographics Similar to Immigrants from Spain by Disability
In terms of disability, the demographic groups most similar to Immigrants from Spain are Jordanian (10.9%, a difference of 0.0%), South American (10.9%, a difference of 0.020%), Peruvian (10.9%, a difference of 0.080%), Vietnamese (10.9%, a difference of 0.090%), and Immigrants from Saudi Arabia (10.9%, a difference of 0.090%).
| Demographics | Rating | Rank | Disability |
| Tongans | 99.9 /100 | #46 | Exceptional 10.8% |
| Taiwanese | 99.9 /100 | #47 | Exceptional 10.8% |
| Soviet Union | 99.9 /100 | #48 | Exceptional 10.9% |
| Vietnamese | 99.9 /100 | #49 | Exceptional 10.9% |
| Immigrants | Saudi Arabia | 99.9 /100 | #50 | Exceptional 10.9% |
| Peruvians | 99.8 /100 | #51 | Exceptional 10.9% |
| South Americans | 99.8 /100 | #52 | Exceptional 10.9% |
| Immigrants | Spain | 99.8 /100 | #53 | Exceptional 10.9% |
| Jordanians | 99.8 /100 | #54 | Exceptional 10.9% |
| Immigrants | El Salvador | 99.8 /100 | #55 | Exceptional 10.9% |
| Immigrants | Lithuania | 99.8 /100 | #56 | Exceptional 10.9% |
| Salvadorans | 99.8 /100 | #57 | Exceptional 10.9% |
| Immigrants | South America | 99.8 /100 | #58 | Exceptional 10.9% |
| Immigrants | Colombia | 99.7 /100 | #59 | Exceptional 10.9% |
| Zimbabweans | 99.7 /100 | #60 | Exceptional 10.9% |