Immigrants from Turkey vs Canadian 4th Grade
COMPARE
Immigrants from Turkey
Canadian
4th Grade
4th Grade Comparison
Immigrants from Turkey
Canadians
97.7%
4TH GRADE
86.0/ 100
METRIC RATING
137th/ 347
METRIC RANK
98.0%
4TH GRADE
99.6/ 100
METRIC RATING
66th/ 347
METRIC RANK
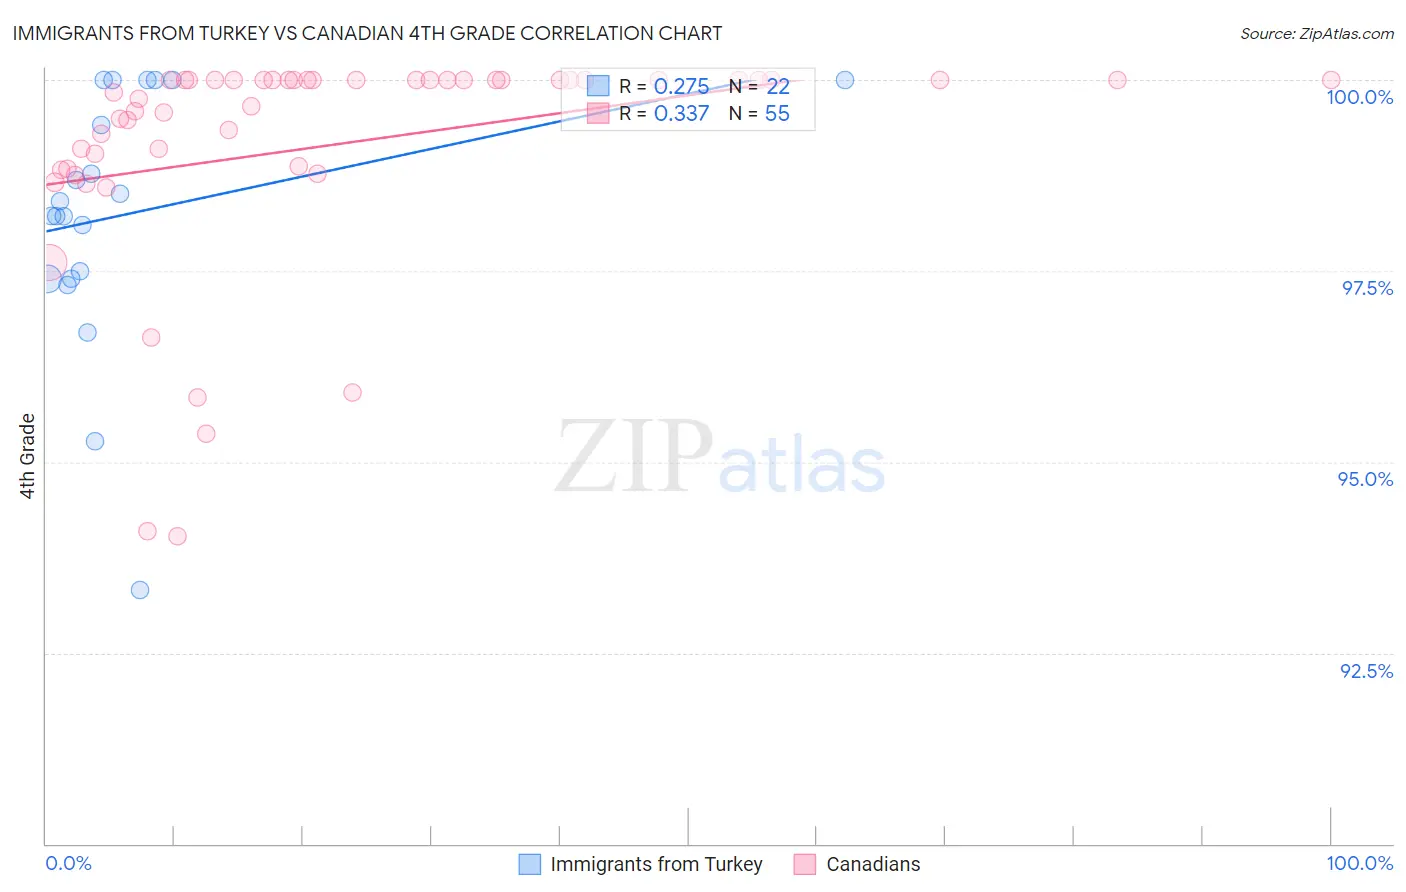
Immigrants from Turkey vs Canadian 4th Grade Correlation Chart
The statistical analysis conducted on geographies consisting of 223,057,877 people shows a weak positive correlation between the proportion of Immigrants from Turkey and percentage of population with at least 4th grade education in the United States with a correlation coefficient (R) of 0.275 and weighted average of 97.7%. Similarly, the statistical analysis conducted on geographies consisting of 437,557,033 people shows a mild positive correlation between the proportion of Canadians and percentage of population with at least 4th grade education in the United States with a correlation coefficient (R) of 0.337 and weighted average of 98.0%, a difference of 0.36%.
4th Grade Correlation Summary
| Measurement | Immigrants from Turkey | Canadian |
| Minimum | 93.3% | 94.0% |
| Maximum | 100.0% | 100.0% |
| Range | 6.7% | 6.0% |
| Mean | 98.2% | 99.1% |
| Median | 98.3% | 100.0% |
| Interquartile 25% (IQ1) | 97.4% | 98.8% |
| Interquartile 75% (IQ3) | 100.0% | 100.0% |
| Interquartile Range (IQR) | 2.6% | 1.2% |
| Standard Deviation (Sample) | 1.7% | 1.5% |
| Standard Deviation (Population) | 1.6% | 1.5% |
Similar Demographics by 4th Grade
Demographics Similar to Immigrants from Turkey by 4th Grade
In terms of 4th grade, the demographic groups most similar to Immigrants from Turkey are Israeli (97.7%, a difference of 0.0%), Blackfeet (97.7%, a difference of 0.0%), Seminole (97.7%, a difference of 0.010%), Filipino (97.7%, a difference of 0.010%), and Hmong (97.7%, a difference of 0.020%).
| Demographics | Rating | Rank | 4th Grade |
| Immigrants | Romania | 90.6 /100 | #130 | Exceptional 97.7% |
| Immigrants | Kuwait | 89.7 /100 | #131 | Excellent 97.7% |
| Immigrants | Hungary | 89.3 /100 | #132 | Excellent 97.7% |
| Hmong | 88.2 /100 | #133 | Excellent 97.7% |
| Palestinians | 88.1 /100 | #134 | Excellent 97.7% |
| Cambodians | 87.8 /100 | #135 | Excellent 97.7% |
| Israelis | 86.2 /100 | #136 | Excellent 97.7% |
| Immigrants | Turkey | 86.0 /100 | #137 | Excellent 97.7% |
| Blackfeet | 86.0 /100 | #138 | Excellent 97.7% |
| Seminole | 84.7 /100 | #139 | Excellent 97.7% |
| Filipinos | 84.0 /100 | #140 | Excellent 97.7% |
| Immigrants | Greece | 83.8 /100 | #141 | Excellent 97.7% |
| Immigrants | North Macedonia | 83.3 /100 | #142 | Excellent 97.7% |
| Burmese | 82.8 /100 | #143 | Excellent 97.7% |
| Spaniards | 82.7 /100 | #144 | Excellent 97.7% |
Demographics Similar to Canadians by 4th Grade
In terms of 4th grade, the demographic groups most similar to Canadians are Immigrants from Northern Europe (98.0%, a difference of 0.0%), New Zealander (98.0%, a difference of 0.0%), Russian (98.0%, a difference of 0.010%), Cajun (98.0%, a difference of 0.010%), and Kiowa (98.0%, a difference of 0.010%).
| Demographics | Rating | Rank | 4th Grade |
| Americans | 99.8 /100 | #59 | Exceptional 98.1% |
| Immigrants | Canada | 99.7 /100 | #60 | Exceptional 98.1% |
| Immigrants | North America | 99.7 /100 | #61 | Exceptional 98.1% |
| Serbians | 99.7 /100 | #62 | Exceptional 98.1% |
| Russians | 99.7 /100 | #63 | Exceptional 98.0% |
| Cajuns | 99.7 /100 | #64 | Exceptional 98.0% |
| Immigrants | Northern Europe | 99.6 /100 | #65 | Exceptional 98.0% |
| Canadians | 99.6 /100 | #66 | Exceptional 98.0% |
| New Zealanders | 99.6 /100 | #67 | Exceptional 98.0% |
| Kiowa | 99.6 /100 | #68 | Exceptional 98.0% |
| Pueblo | 99.6 /100 | #69 | Exceptional 98.0% |
| Immigrants | Austria | 99.6 /100 | #70 | Exceptional 98.0% |
| Lumbee | 99.6 /100 | #71 | Exceptional 98.0% |
| Iranians | 99.4 /100 | #72 | Exceptional 98.0% |
| Macedonians | 99.4 /100 | #73 | Exceptional 98.0% |