Mongolian vs Immigrants from Bulgaria Male Disability
COMPARE
Mongolian
Immigrants from Bulgaria
Male Disability
Male Disability Comparison
Mongolians
Immigrants from Bulgaria
10.3%
MALE DISABILITY
99.7/ 100
METRIC RATING
42nd/ 347
METRIC RANK
10.5%
MALE DISABILITY
99.1/ 100
METRIC RATING
70th/ 347
METRIC RANK
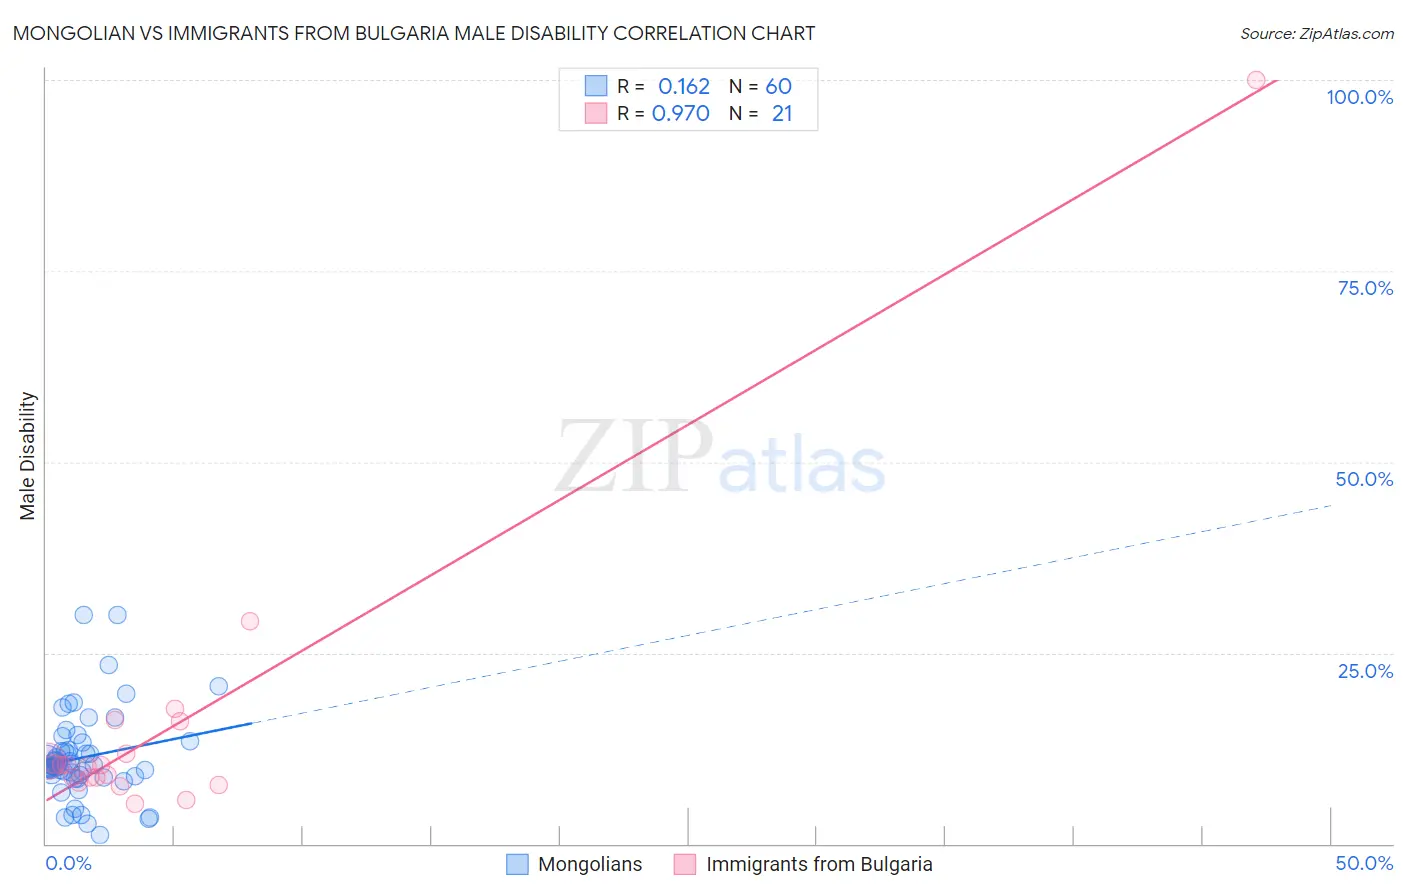
Mongolian vs Immigrants from Bulgaria Male Disability Correlation Chart
The statistical analysis conducted on geographies consisting of 140,361,312 people shows a poor positive correlation between the proportion of Mongolians and percentage of males with a disability in the United States with a correlation coefficient (R) of 0.162 and weighted average of 10.3%. Similarly, the statistical analysis conducted on geographies consisting of 172,550,350 people shows a perfect positive correlation between the proportion of Immigrants from Bulgaria and percentage of males with a disability in the United States with a correlation coefficient (R) of 0.970 and weighted average of 10.5%, a difference of 1.9%.
Male Disability Correlation Summary
| Measurement | Mongolian | Immigrants from Bulgaria |
| Minimum | 1.1% | 5.2% |
| Maximum | 30.0% | 100.0% |
| Range | 28.9% | 94.8% |
| Mean | 11.3% | 15.4% |
| Median | 10.1% | 10.3% |
| Interquartile 25% (IQ1) | 8.9% | 8.3% |
| Interquartile 75% (IQ3) | 12.8% | 14.0% |
| Interquartile Range (IQR) | 3.9% | 5.7% |
| Standard Deviation (Sample) | 5.7% | 20.1% |
| Standard Deviation (Population) | 5.6% | 19.6% |
Similar Demographics by Male Disability
Demographics Similar to Mongolians by Male Disability
In terms of male disability, the demographic groups most similar to Mongolians are Immigrants from Bangladesh (10.3%, a difference of 0.020%), Immigrants from El Salvador (10.3%, a difference of 0.090%), Turkish (10.3%, a difference of 0.10%), Cambodian (10.3%, a difference of 0.18%), and Immigrants from Peru (10.3%, a difference of 0.22%).
| Demographics | Rating | Rank | Male Disability |
| Immigrants | Argentina | 99.9 /100 | #35 | Exceptional 10.2% |
| Ethiopians | 99.8 /100 | #36 | Exceptional 10.2% |
| Immigrants | Indonesia | 99.8 /100 | #37 | Exceptional 10.2% |
| Immigrants | Kuwait | 99.8 /100 | #38 | Exceptional 10.2% |
| Afghans | 99.8 /100 | #39 | Exceptional 10.2% |
| Immigrants | Nepal | 99.8 /100 | #40 | Exceptional 10.3% |
| Taiwanese | 99.8 /100 | #41 | Exceptional 10.3% |
| Mongolians | 99.7 /100 | #42 | Exceptional 10.3% |
| Immigrants | Bangladesh | 99.7 /100 | #43 | Exceptional 10.3% |
| Immigrants | El Salvador | 99.7 /100 | #44 | Exceptional 10.3% |
| Turks | 99.7 /100 | #45 | Exceptional 10.3% |
| Cambodians | 99.7 /100 | #46 | Exceptional 10.3% |
| Immigrants | Peru | 99.7 /100 | #47 | Exceptional 10.3% |
| Israelis | 99.7 /100 | #48 | Exceptional 10.3% |
| Immigrants | Spain | 99.7 /100 | #49 | Exceptional 10.3% |
Demographics Similar to Immigrants from Bulgaria by Male Disability
In terms of male disability, the demographic groups most similar to Immigrants from Bulgaria are Colombian (10.5%, a difference of 0.14%), Ecuadorian (10.5%, a difference of 0.14%), Immigrants from Cameroon (10.5%, a difference of 0.15%), Immigrants from Serbia (10.5%, a difference of 0.20%), and Immigrants from Afghanistan (10.5%, a difference of 0.24%).
| Demographics | Rating | Rank | Male Disability |
| Immigrants | Belarus | 99.3 /100 | #63 | Exceptional 10.4% |
| Jordanians | 99.3 /100 | #64 | Exceptional 10.5% |
| Immigrants | Grenada | 99.2 /100 | #65 | Exceptional 10.5% |
| Guyanese | 99.2 /100 | #66 | Exceptional 10.5% |
| Immigrants | Afghanistan | 99.2 /100 | #67 | Exceptional 10.5% |
| Colombians | 99.2 /100 | #68 | Exceptional 10.5% |
| Ecuadorians | 99.2 /100 | #69 | Exceptional 10.5% |
| Immigrants | Bulgaria | 99.1 /100 | #70 | Exceptional 10.5% |
| Immigrants | Cameroon | 99.0 /100 | #71 | Exceptional 10.5% |
| Immigrants | Serbia | 99.0 /100 | #72 | Exceptional 10.5% |
| Immigrants | Lithuania | 98.9 /100 | #73 | Exceptional 10.5% |
| Immigrants | Lebanon | 98.8 /100 | #74 | Exceptional 10.5% |
| Sierra Leoneans | 98.7 /100 | #75 | Exceptional 10.5% |
| Immigrants | Sierra Leone | 98.7 /100 | #76 | Exceptional 10.5% |
| Laotians | 98.6 /100 | #77 | Exceptional 10.6% |