Immigrants from Trinidad and Tobago vs Immigrants from Bulgaria Kindergarten
COMPARE
Immigrants from Trinidad and Tobago
Immigrants from Bulgaria
Kindergarten
Kindergarten Comparison
Immigrants from Trinidad and Tobago
Immigrants from Bulgaria
97.3%
KINDERGARTEN
0.0/ 100
METRIC RATING
284th/ 347
METRIC RANK
98.1%
KINDERGARTEN
89.4/ 100
METRIC RATING
134th/ 347
METRIC RANK
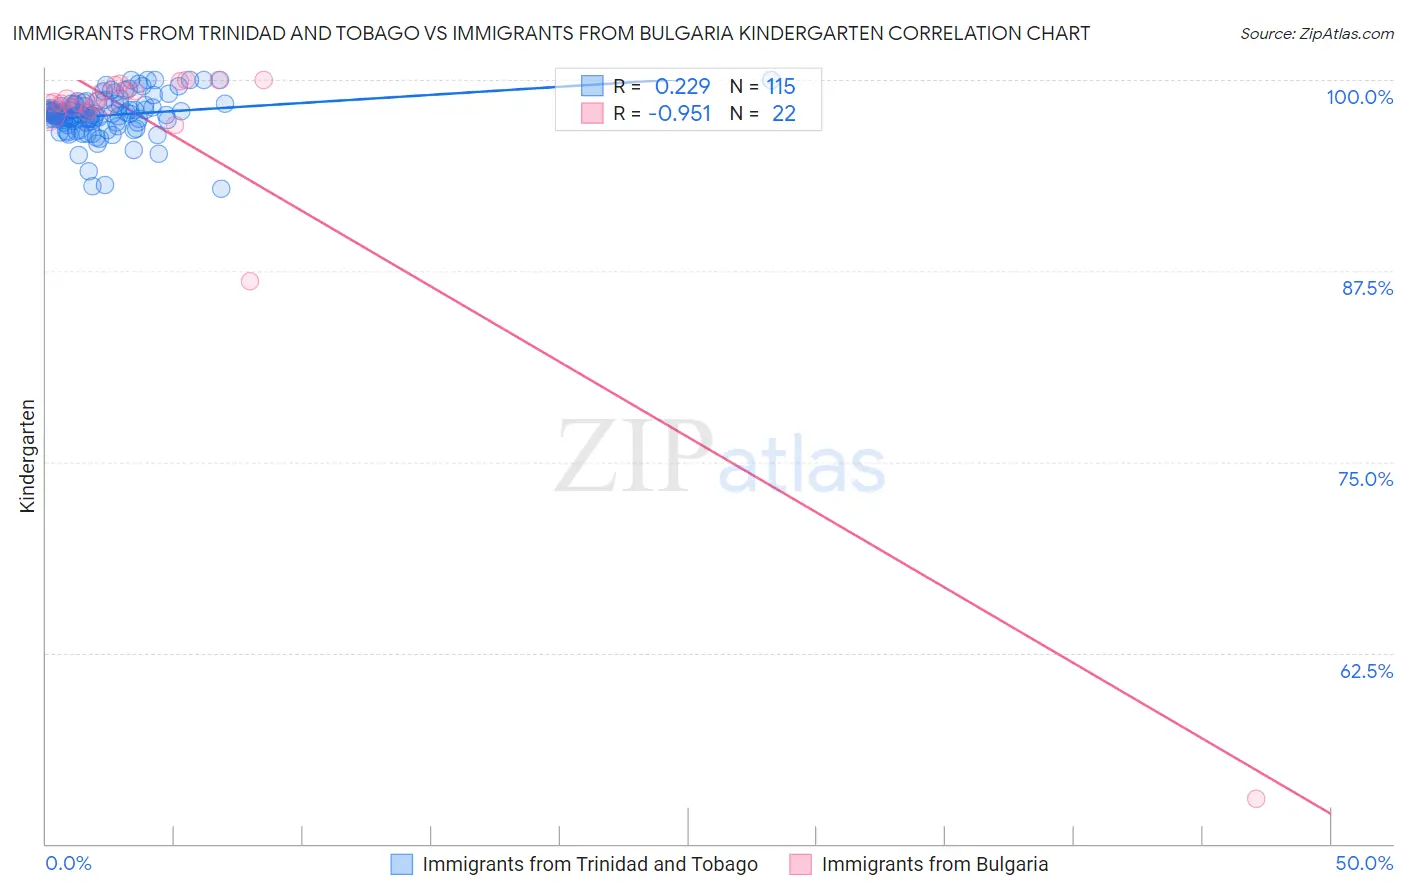
Immigrants from Trinidad and Tobago vs Immigrants from Bulgaria Kindergarten Correlation Chart
The statistical analysis conducted on geographies consisting of 223,545,304 people shows a weak positive correlation between the proportion of Immigrants from Trinidad and Tobago and percentage of population with at least kindergarten education in the United States with a correlation coefficient (R) of 0.229 and weighted average of 97.3%. Similarly, the statistical analysis conducted on geographies consisting of 172,552,181 people shows a perfect negative correlation between the proportion of Immigrants from Bulgaria and percentage of population with at least kindergarten education in the United States with a correlation coefficient (R) of -0.951 and weighted average of 98.1%, a difference of 0.79%.
Kindergarten Correlation Summary
| Measurement | Immigrants from Trinidad and Tobago | Immigrants from Bulgaria |
| Minimum | 92.9% | 52.9% |
| Maximum | 100.0% | 100.0% |
| Range | 7.1% | 47.1% |
| Mean | 97.7% | 96.2% |
| Median | 97.8% | 98.6% |
| Interquartile 25% (IQ1) | 97.2% | 98.1% |
| Interquartile 75% (IQ3) | 98.4% | 99.7% |
| Interquartile Range (IQR) | 1.1% | 1.5% |
| Standard Deviation (Sample) | 1.3% | 10.0% |
| Standard Deviation (Population) | 1.3% | 9.8% |
Similar Demographics by Kindergarten
Demographics Similar to Immigrants from Trinidad and Tobago by Kindergarten
In terms of kindergarten, the demographic groups most similar to Immigrants from Trinidad and Tobago are Immigrants from West Indies (97.3%, a difference of 0.010%), Immigrants from Portugal (97.3%, a difference of 0.010%), Immigrants from Barbados (97.3%, a difference of 0.020%), Immigrants from Hong Kong (97.3%, a difference of 0.020%), and Immigrants from Thailand (97.3%, a difference of 0.030%).
| Demographics | Rating | Rank | Kindergarten |
| Immigrants | Western Africa | 0.1 /100 | #277 | Tragic 97.4% |
| Immigrants | Uzbekistan | 0.1 /100 | #278 | Tragic 97.4% |
| Immigrants | Ghana | 0.1 /100 | #279 | Tragic 97.4% |
| Barbadians | 0.1 /100 | #280 | Tragic 97.4% |
| Trinidadians and Tobagonians | 0.1 /100 | #281 | Tragic 97.4% |
| Afghans | 0.0 /100 | #282 | Tragic 97.4% |
| Immigrants | West Indies | 0.0 /100 | #283 | Tragic 97.3% |
| Immigrants | Trinidad and Tobago | 0.0 /100 | #284 | Tragic 97.3% |
| Immigrants | Portugal | 0.0 /100 | #285 | Tragic 97.3% |
| Immigrants | Barbados | 0.0 /100 | #286 | Tragic 97.3% |
| Immigrants | Hong Kong | 0.0 /100 | #287 | Tragic 97.3% |
| Immigrants | Thailand | 0.0 /100 | #288 | Tragic 97.3% |
| Immigrants | Afghanistan | 0.0 /100 | #289 | Tragic 97.3% |
| Immigrants | St. Vincent and the Grenadines | 0.0 /100 | #290 | Tragic 97.3% |
| Houma | 0.0 /100 | #291 | Tragic 97.3% |
Demographics Similar to Immigrants from Bulgaria by Kindergarten
In terms of kindergarten, the demographic groups most similar to Immigrants from Bulgaria are Immigrants from Kuwait (98.1%, a difference of 0.0%), Immigrants from Hungary (98.1%, a difference of 0.0%), Spaniard (98.1%, a difference of 0.010%), Immigrants from Europe (98.1%, a difference of 0.010%), and Blackfeet (98.1%, a difference of 0.010%).
| Demographics | Rating | Rank | Kindergarten |
| Immigrants | Saudi Arabia | 93.1 /100 | #127 | Exceptional 98.1% |
| Immigrants | Serbia | 92.4 /100 | #128 | Exceptional 98.1% |
| Seminole | 91.5 /100 | #129 | Exceptional 98.1% |
| Immigrants | Croatia | 91.2 /100 | #130 | Exceptional 98.1% |
| Cambodians | 91.2 /100 | #131 | Exceptional 98.1% |
| Spaniards | 91.0 /100 | #132 | Exceptional 98.1% |
| Immigrants | Europe | 90.4 /100 | #133 | Exceptional 98.1% |
| Immigrants | Bulgaria | 89.4 /100 | #134 | Excellent 98.1% |
| Immigrants | Kuwait | 89.2 /100 | #135 | Excellent 98.1% |
| Immigrants | Hungary | 89.1 /100 | #136 | Excellent 98.1% |
| Blackfeet | 87.8 /100 | #137 | Excellent 98.1% |
| Immigrants | Romania | 87.7 /100 | #138 | Excellent 98.1% |
| Israelis | 87.7 /100 | #139 | Excellent 98.1% |
| Palestinians | 83.6 /100 | #140 | Excellent 98.1% |
| Marshallese | 83.0 /100 | #141 | Excellent 98.1% |