Immigrants from Thailand vs Czechoslovakian In Labor Force | Age 20-24
COMPARE
Immigrants from Thailand
Czechoslovakian
In Labor Force | Age 20-24
In Labor Force | Age 20-24 Comparison
Immigrants from Thailand
Czechoslovakians
76.4%
IN LABOR FORCE | AGE 20-24
99.3/ 100
METRIC RATING
87th/ 347
METRIC RANK
77.5%
IN LABOR FORCE | AGE 20-24
100.0/ 100
METRIC RATING
37th/ 347
METRIC RANK
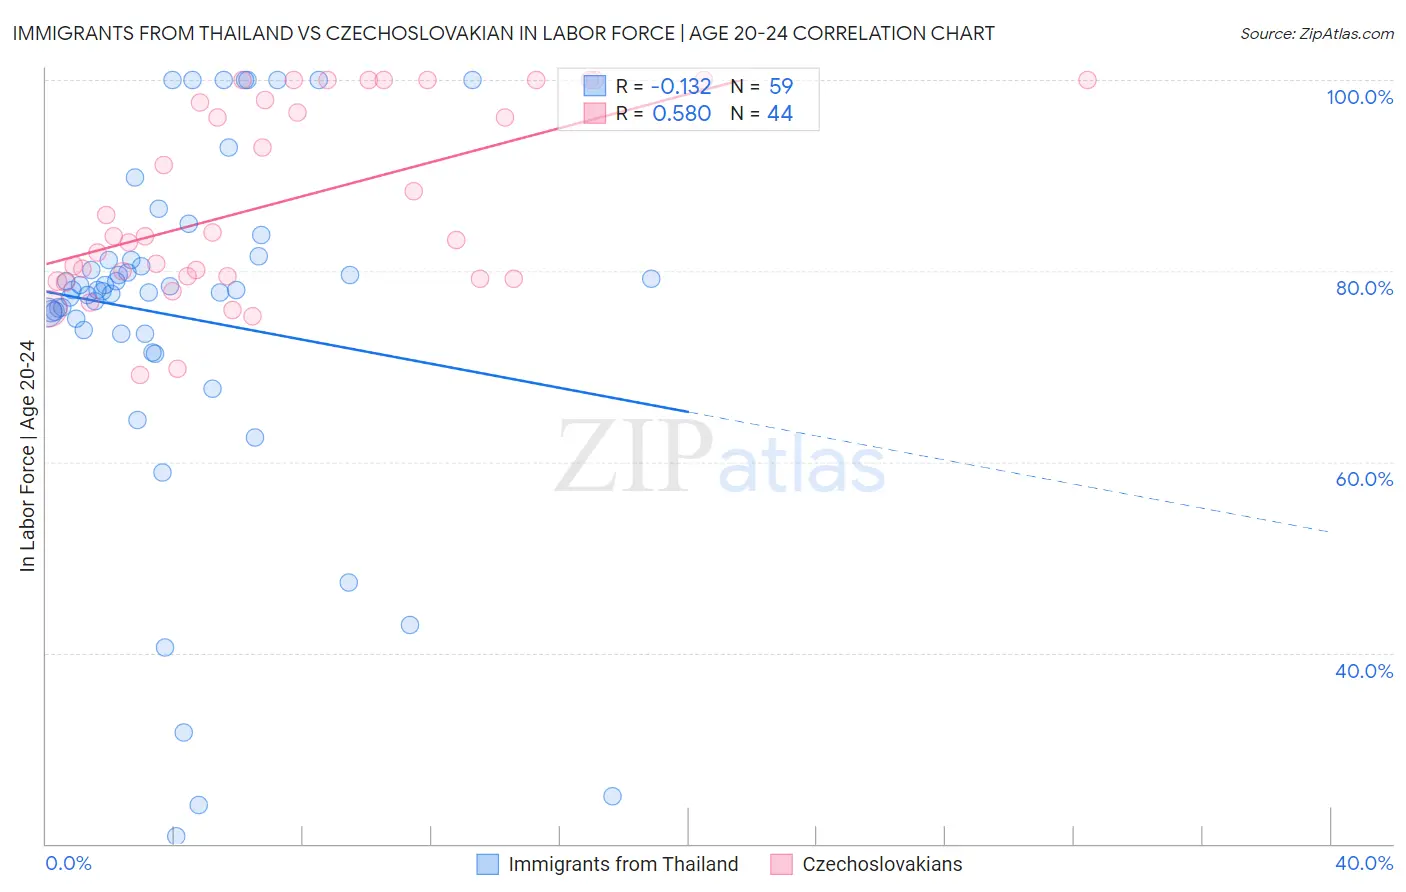
Immigrants from Thailand vs Czechoslovakian In Labor Force | Age 20-24 Correlation Chart
The statistical analysis conducted on geographies consisting of 316,957,721 people shows a poor negative correlation between the proportion of Immigrants from Thailand and labor force participation rate among population between the ages 20 and 24 in the United States with a correlation coefficient (R) of -0.132 and weighted average of 76.4%. Similarly, the statistical analysis conducted on geographies consisting of 368,456,414 people shows a substantial positive correlation between the proportion of Czechoslovakians and labor force participation rate among population between the ages 20 and 24 in the United States with a correlation coefficient (R) of 0.580 and weighted average of 77.5%, a difference of 1.4%.
In Labor Force | Age 20-24 Correlation Summary
| Measurement | Immigrants from Thailand | Czechoslovakian |
| Minimum | 20.8% | 69.1% |
| Maximum | 100.0% | 100.0% |
| Range | 79.2% | 30.9% |
| Mean | 75.2% | 87.3% |
| Median | 78.0% | 83.6% |
| Interquartile 25% (IQ1) | 73.4% | 79.3% |
| Interquartile 75% (IQ3) | 81.1% | 98.9% |
| Interquartile Range (IQR) | 7.7% | 19.6% |
| Standard Deviation (Sample) | 18.5% | 10.0% |
| Standard Deviation (Population) | 18.3% | 9.8% |
Similar Demographics by In Labor Force | Age 20-24
Demographics Similar to Immigrants from Thailand by In Labor Force | Age 20-24
In terms of in labor force | age 20-24, the demographic groups most similar to Immigrants from Thailand are Immigrants from Iraq (76.4%, a difference of 0.0%), Portuguese (76.4%, a difference of 0.030%), Austrian (76.5%, a difference of 0.050%), Spanish (76.4%, a difference of 0.050%), and Carpatho Rusyn (76.5%, a difference of 0.060%).
| Demographics | Rating | Rank | In Labor Force | Age 20-24 |
| Italians | 99.6 /100 | #80 | Exceptional 76.5% |
| Basques | 99.5 /100 | #81 | Exceptional 76.5% |
| Hmong | 99.5 /100 | #82 | Exceptional 76.5% |
| Carpatho Rusyns | 99.4 /100 | #83 | Exceptional 76.5% |
| Austrians | 99.4 /100 | #84 | Exceptional 76.5% |
| Portuguese | 99.3 /100 | #85 | Exceptional 76.4% |
| Immigrants | Iraq | 99.3 /100 | #86 | Exceptional 76.4% |
| Immigrants | Thailand | 99.3 /100 | #87 | Exceptional 76.4% |
| Spanish | 99.2 /100 | #88 | Exceptional 76.4% |
| Bulgarians | 99.2 /100 | #89 | Exceptional 76.4% |
| Immigrants | Burma/Myanmar | 99.1 /100 | #90 | Exceptional 76.3% |
| Sierra Leoneans | 99.0 /100 | #91 | Exceptional 76.3% |
| Maltese | 98.9 /100 | #92 | Exceptional 76.3% |
| Hungarians | 98.9 /100 | #93 | Exceptional 76.3% |
| Potawatomi | 98.5 /100 | #94 | Exceptional 76.2% |
Demographics Similar to Czechoslovakians by In Labor Force | Age 20-24
In terms of in labor force | age 20-24, the demographic groups most similar to Czechoslovakians are Welsh (77.5%, a difference of 0.010%), Immigrants from Eastern Africa (77.5%, a difference of 0.030%), Immigrants from Ethiopia (77.5%, a difference of 0.050%), German Russian (77.5%, a difference of 0.050%), and Marshallese (77.4%, a difference of 0.050%).
| Demographics | Rating | Rank | In Labor Force | Age 20-24 |
| Swiss | 100.0 /100 | #30 | Exceptional 77.7% |
| Poles | 100.0 /100 | #31 | Exceptional 77.6% |
| English | 100.0 /100 | #32 | Exceptional 77.6% |
| Immigrants | Ethiopia | 100.0 /100 | #33 | Exceptional 77.5% |
| German Russians | 100.0 /100 | #34 | Exceptional 77.5% |
| Immigrants | Eastern Africa | 100.0 /100 | #35 | Exceptional 77.5% |
| Welsh | 100.0 /100 | #36 | Exceptional 77.5% |
| Czechoslovakians | 100.0 /100 | #37 | Exceptional 77.5% |
| Marshallese | 100.0 /100 | #38 | Exceptional 77.4% |
| Irish | 100.0 /100 | #39 | Exceptional 77.4% |
| Scottish | 100.0 /100 | #40 | Exceptional 77.4% |
| Immigrants | Congo | 100.0 /100 | #41 | Exceptional 77.4% |
| French | 100.0 /100 | #42 | Exceptional 77.4% |
| Immigrants | Laos | 100.0 /100 | #43 | Exceptional 77.4% |
| Fijians | 100.0 /100 | #44 | Exceptional 77.4% |