Paiute vs Immigrants from Switzerland Disability Age Under 5
COMPARE
Paiute
Immigrants from Switzerland
Disability Age Under 5
Disability Age Under 5 Comparison
Paiute
Immigrants from Switzerland
3.9%
DISABILITY AGE UNDER 5
0.0/ 100
METRIC RATING
345th/ 347
METRIC RANK
1.1%
DISABILITY AGE UNDER 5
99.2/ 100
METRIC RATING
62nd/ 347
METRIC RANK
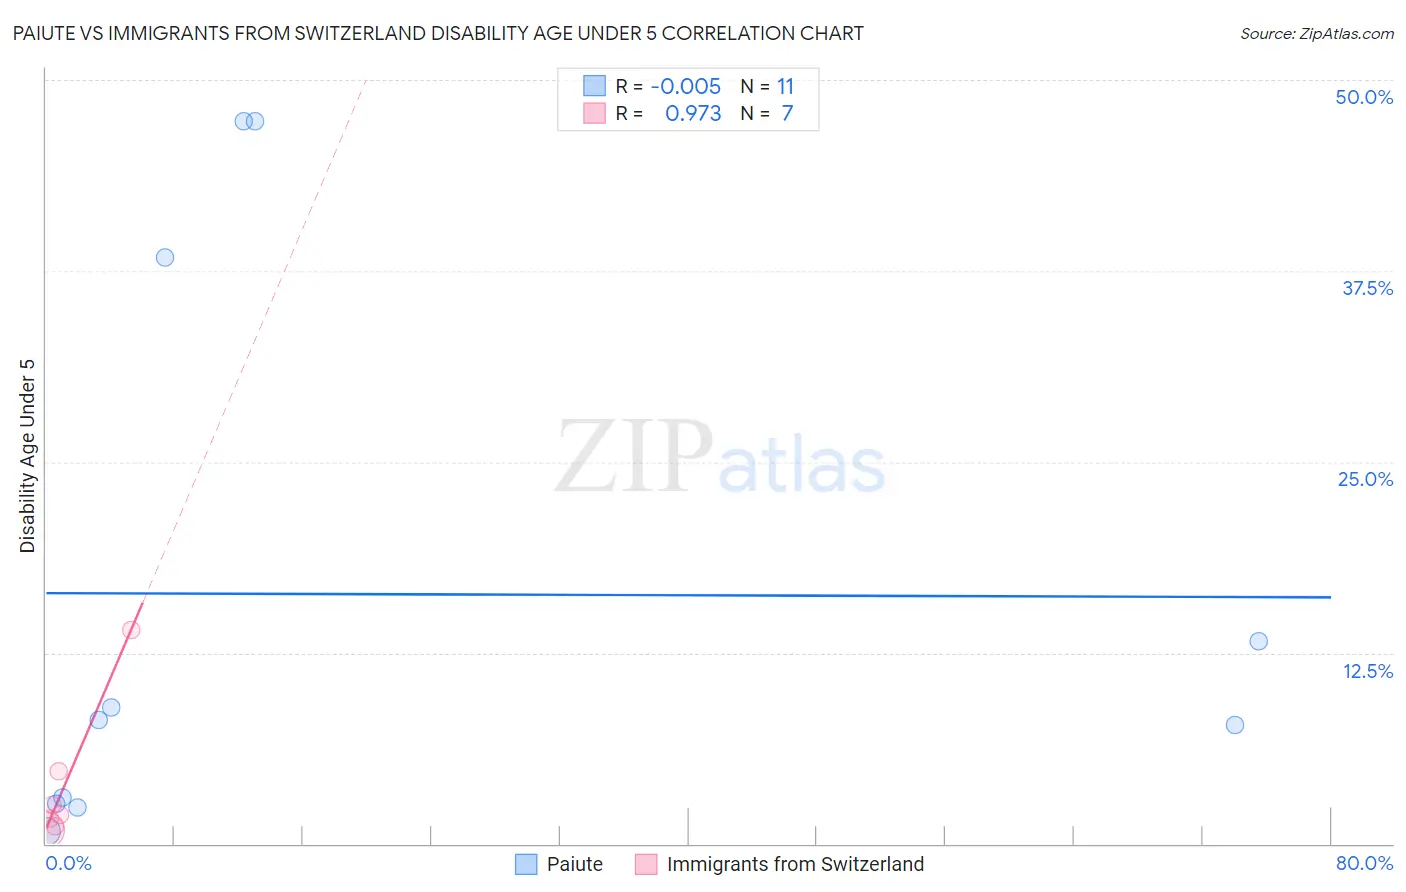
Paiute vs Immigrants from Switzerland Disability Age Under 5 Correlation Chart
The statistical analysis conducted on geographies consisting of 49,758,622 people shows no correlation between the proportion of Paiute and percentage of population with a disability under the age of 5 in the United States with a correlation coefficient (R) of -0.005 and weighted average of 3.9%. Similarly, the statistical analysis conducted on geographies consisting of 99,521,676 people shows a perfect positive correlation between the proportion of Immigrants from Switzerland and percentage of population with a disability under the age of 5 in the United States with a correlation coefficient (R) of 0.973 and weighted average of 1.1%, a difference of 253.3%.
Disability Age Under 5 Correlation Summary
| Measurement | Paiute | Immigrants from Switzerland |
| Minimum | 0.83% | 0.89% |
| Maximum | 47.3% | 14.0% |
| Range | 46.5% | 13.1% |
| Mean | 16.3% | 3.8% |
| Median | 8.1% | 1.8% |
| Interquartile 25% (IQ1) | 2.6% | 1.1% |
| Interquartile 75% (IQ3) | 38.4% | 4.7% |
| Interquartile Range (IQR) | 35.7% | 3.6% |
| Standard Deviation (Sample) | 18.5% | 4.6% |
| Standard Deviation (Population) | 17.6% | 4.3% |
Similar Demographics by Disability Age Under 5
Demographics Similar to Paiute by Disability Age Under 5
In terms of disability age under 5, the demographic groups most similar to Paiute are Inupiat (3.7%, a difference of 5.3%), Yup'ik (4.5%, a difference of 15.8%), Hopi (4.6%, a difference of 18.4%), Colville (3.3%, a difference of 19.0%), and Alaska Native (2.9%, a difference of 32.9%).
| Demographics | Rating | Rank | Disability Age Under 5 |
| Dutch West Indians | 0.0 /100 | #333 | Tragic 1.9% |
| Natives/Alaskans | 0.0 /100 | #334 | Tragic 1.9% |
| Pennsylvania Germans | 0.0 /100 | #335 | Tragic 1.9% |
| Paraguayans | 0.0 /100 | #336 | Tragic 2.0% |
| Apache | 0.0 /100 | #337 | Tragic 2.0% |
| Tohono O'odham | 0.0 /100 | #338 | Tragic 2.2% |
| Immigrants | Azores | 0.0 /100 | #339 | Tragic 2.2% |
| Menominee | 0.0 /100 | #340 | Tragic 2.3% |
| Tsimshian | 0.0 /100 | #341 | Tragic 2.4% |
| Alaska Natives | 0.0 /100 | #342 | Tragic 2.9% |
| Colville | 0.0 /100 | #343 | Tragic 3.3% |
| Inupiat | 0.0 /100 | #344 | Tragic 3.7% |
| Paiute | 0.0 /100 | #345 | Tragic 3.9% |
| Yup'ik | 0.0 /100 | #346 | Tragic 4.5% |
| Hopi | 0.0 /100 | #347 | Tragic 4.6% |
Demographics Similar to Immigrants from Switzerland by Disability Age Under 5
In terms of disability age under 5, the demographic groups most similar to Immigrants from Switzerland are Immigrants from Ethiopia (1.1%, a difference of 0.010%), Immigrants from Western Asia (1.1%, a difference of 0.070%), Immigrants from Vietnam (1.1%, a difference of 0.11%), Egyptian (1.1%, a difference of 0.57%), and Immigrants from Malaysia (1.1%, a difference of 0.83%).
| Demographics | Rating | Rank | Disability Age Under 5 |
| Salvadorans | 99.5 /100 | #55 | Exceptional 1.1% |
| Ecuadorians | 99.5 /100 | #56 | Exceptional 1.1% |
| Assyrians/Chaldeans/Syriacs | 99.5 /100 | #57 | Exceptional 1.1% |
| Immigrants | Egypt | 99.4 /100 | #58 | Exceptional 1.1% |
| Immigrants | Malaysia | 99.4 /100 | #59 | Exceptional 1.1% |
| Immigrants | Western Asia | 99.2 /100 | #60 | Exceptional 1.1% |
| Immigrants | Ethiopia | 99.2 /100 | #61 | Exceptional 1.1% |
| Immigrants | Switzerland | 99.2 /100 | #62 | Exceptional 1.1% |
| Immigrants | Vietnam | 99.1 /100 | #63 | Exceptional 1.1% |
| Egyptians | 98.9 /100 | #64 | Exceptional 1.1% |
| Immigrants | Korea | 98.8 /100 | #65 | Exceptional 1.1% |
| Immigrants | Indonesia | 98.7 /100 | #66 | Exceptional 1.1% |
| Immigrants | Belize | 98.7 /100 | #67 | Exceptional 1.1% |
| South Africans | 98.7 /100 | #68 | Exceptional 1.1% |
| Israelis | 98.7 /100 | #69 | Exceptional 1.1% |