Immigrants from Syria vs Hispanic or Latino Householder Income Ages 45 - 64 years
COMPARE
Immigrants from Syria
Hispanic or Latino
Householder Income Ages 45 - 64 years
Householder Income Ages 45 - 64 years Comparison
Immigrants from Syria
Hispanics or Latinos
$104,858
HOUSEHOLDER INCOME AGES 45 - 64 YEARS
90.7/ 100
METRIC RATING
131st/ 347
METRIC RANK
$86,006
HOUSEHOLDER INCOME AGES 45 - 64 YEARS
0.1/ 100
METRIC RATING
291st/ 347
METRIC RANK
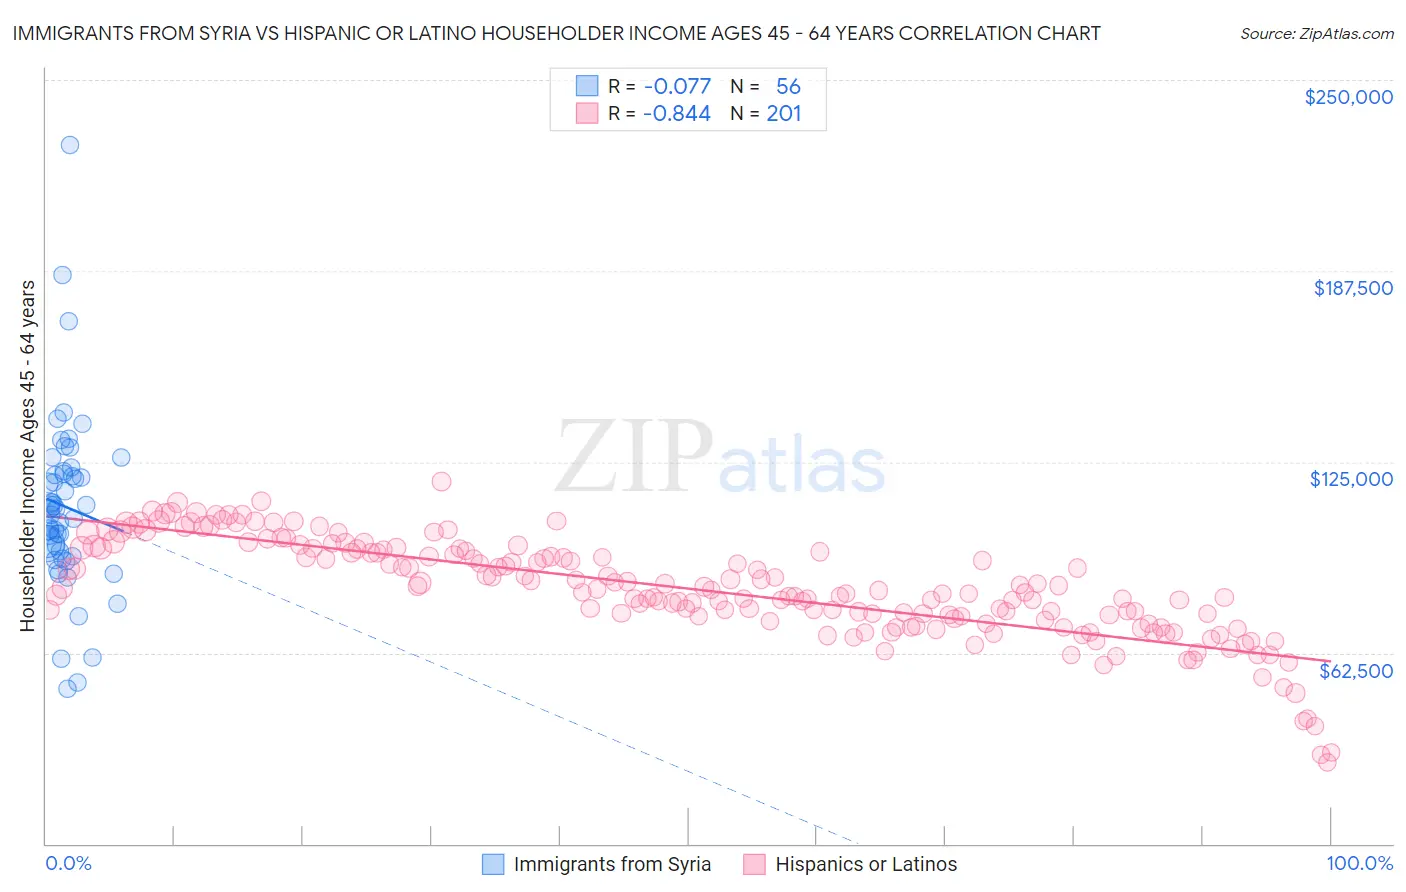
Immigrants from Syria vs Hispanic or Latino Householder Income Ages 45 - 64 years Correlation Chart
The statistical analysis conducted on geographies consisting of 174,068,241 people shows a slight negative correlation between the proportion of Immigrants from Syria and household income with householder between the ages 45 and 64 in the United States with a correlation coefficient (R) of -0.077 and weighted average of $104,858. Similarly, the statistical analysis conducted on geographies consisting of 574,103,825 people shows a very strong negative correlation between the proportion of Hispanics or Latinos and household income with householder between the ages 45 and 64 in the United States with a correlation coefficient (R) of -0.844 and weighted average of $86,006, a difference of 21.9%.
Householder Income Ages 45 - 64 years Correlation Summary
| Measurement | Immigrants from Syria | Hispanic or Latino |
| Minimum | $50,774 | $26,626 |
| Maximum | $228,894 | $118,670 |
| Range | $178,120 | $92,045 |
| Mean | $110,346 | $83,367 |
| Median | $109,693 | $82,863 |
| Interquartile 25% (IQ1) | $94,783 | $74,106 |
| Interquartile 75% (IQ3) | $121,434 | $96,088 |
| Interquartile Range (IQR) | $26,651 | $21,982 |
| Standard Deviation (Sample) | $29,383 | $16,403 |
| Standard Deviation (Population) | $29,119 | $16,362 |
Similar Demographics by Householder Income Ages 45 - 64 years
Demographics Similar to Immigrants from Syria by Householder Income Ages 45 - 64 years
In terms of householder income ages 45 - 64 years, the demographic groups most similar to Immigrants from Syria are Lebanese ($104,734, a difference of 0.12%), Immigrants from Zimbabwe ($104,992, a difference of 0.13%), Peruvian ($105,070, a difference of 0.20%), Native Hawaiian ($105,149, a difference of 0.28%), and Arab ($104,566, a difference of 0.28%).
| Demographics | Rating | Rank | Householder Income Ages 45 - 64 years |
| Immigrants | Northern Africa | 92.8 /100 | #124 | Exceptional $105,430 |
| Pakistanis | 92.4 /100 | #125 | Exceptional $105,317 |
| Portuguese | 92.4 /100 | #126 | Exceptional $105,309 |
| Immigrants | Saudi Arabia | 92.2 /100 | #127 | Exceptional $105,249 |
| Native Hawaiians | 91.8 /100 | #128 | Exceptional $105,149 |
| Peruvians | 91.5 /100 | #129 | Exceptional $105,070 |
| Immigrants | Zimbabwe | 91.2 /100 | #130 | Exceptional $104,992 |
| Immigrants | Syria | 90.7 /100 | #131 | Exceptional $104,858 |
| Lebanese | 90.1 /100 | #132 | Exceptional $104,734 |
| Arabs | 89.3 /100 | #133 | Excellent $104,566 |
| Canadians | 89.3 /100 | #134 | Excellent $104,560 |
| Brazilians | 88.6 /100 | #135 | Excellent $104,408 |
| Taiwanese | 87.4 /100 | #136 | Excellent $104,180 |
| Hungarians | 85.8 /100 | #137 | Excellent $103,913 |
| Ethiopians | 84.7 /100 | #138 | Excellent $103,736 |
Demographics Similar to Hispanics or Latinos by Householder Income Ages 45 - 64 years
In terms of householder income ages 45 - 64 years, the demographic groups most similar to Hispanics or Latinos are Immigrants from Central America ($85,965, a difference of 0.050%), Cherokee ($86,125, a difference of 0.14%), Comanche ($85,787, a difference of 0.25%), Cuban ($86,301, a difference of 0.34%), and Immigrants from St. Vincent and the Grenadines ($86,394, a difference of 0.45%).
| Demographics | Rating | Rank | Householder Income Ages 45 - 64 years |
| Central American Indians | 0.1 /100 | #284 | Tragic $86,764 |
| Blackfeet | 0.1 /100 | #285 | Tragic $86,595 |
| Immigrants | Guatemala | 0.1 /100 | #286 | Tragic $86,573 |
| Bangladeshis | 0.1 /100 | #287 | Tragic $86,402 |
| Immigrants | St. Vincent and the Grenadines | 0.1 /100 | #288 | Tragic $86,394 |
| Cubans | 0.1 /100 | #289 | Tragic $86,301 |
| Cherokee | 0.1 /100 | #290 | Tragic $86,125 |
| Hispanics or Latinos | 0.1 /100 | #291 | Tragic $86,006 |
| Immigrants | Central America | 0.1 /100 | #292 | Tragic $85,965 |
| Comanche | 0.1 /100 | #293 | Tragic $85,787 |
| British West Indians | 0.1 /100 | #294 | Tragic $85,571 |
| Immigrants | Grenada | 0.1 /100 | #295 | Tragic $85,552 |
| Immigrants | Zaire | 0.1 /100 | #296 | Tragic $85,207 |
| Fijians | 0.1 /100 | #297 | Tragic $85,187 |
| Africans | 0.0 /100 | #298 | Tragic $84,925 |