Immigrants from Syria vs Hispanic or Latino In Labor Force | Age 20-24
COMPARE
Immigrants from Syria
Hispanic or Latino
In Labor Force | Age 20-24
In Labor Force | Age 20-24 Comparison
Immigrants from Syria
Hispanics or Latinos
74.0%
IN LABOR FORCE | AGE 20-24
1.9/ 100
METRIC RATING
243rd/ 347
METRIC RANK
74.4%
IN LABOR FORCE | AGE 20-24
7.9/ 100
METRIC RATING
223rd/ 347
METRIC RANK
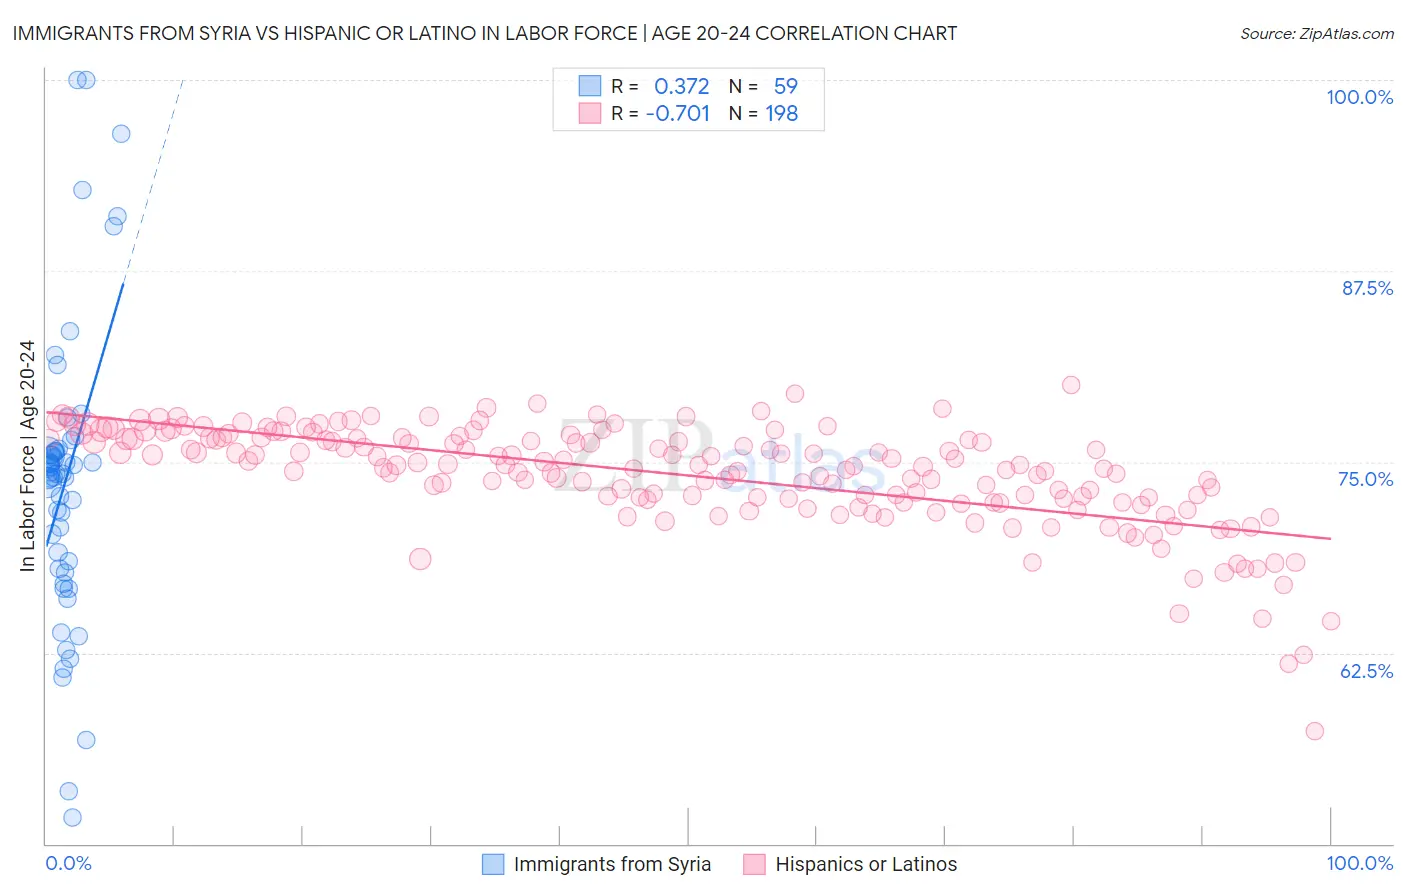
Immigrants from Syria vs Hispanic or Latino In Labor Force | Age 20-24 Correlation Chart
The statistical analysis conducted on geographies consisting of 174,096,608 people shows a mild positive correlation between the proportion of Immigrants from Syria and labor force participation rate among population between the ages 20 and 24 in the United States with a correlation coefficient (R) of 0.372 and weighted average of 74.0%. Similarly, the statistical analysis conducted on geographies consisting of 573,599,041 people shows a strong negative correlation between the proportion of Hispanics or Latinos and labor force participation rate among population between the ages 20 and 24 in the United States with a correlation coefficient (R) of -0.701 and weighted average of 74.4%, a difference of 0.55%.
In Labor Force | Age 20-24 Correlation Summary
| Measurement | Immigrants from Syria | Hispanic or Latino |
| Minimum | 51.7% | 57.4% |
| Maximum | 100.0% | 80.0% |
| Range | 48.3% | 22.7% |
| Mean | 73.8% | 74.1% |
| Median | 74.2% | 74.8% |
| Interquartile 25% (IQ1) | 68.0% | 72.6% |
| Interquartile 75% (IQ3) | 75.7% | 76.6% |
| Interquartile Range (IQR) | 7.7% | 4.0% |
| Standard Deviation (Sample) | 9.7% | 3.4% |
| Standard Deviation (Population) | 9.6% | 3.4% |
Demographics Similar to Immigrants from Syria and Hispanics or Latinos by In Labor Force | Age 20-24
In terms of in labor force | age 20-24, the demographic groups most similar to Immigrants from Syria are Thai (74.0%, a difference of 0.030%), Immigrants from Senegal (74.0%, a difference of 0.040%), Immigrants from Sri Lanka (74.0%, a difference of 0.070%), Immigrants from Latin America (74.1%, a difference of 0.12%), and Immigrants from Japan (74.1%, a difference of 0.17%). Similarly, the demographic groups most similar to Hispanics or Latinos are Seminole (74.3%, a difference of 0.060%), Ghanaian (74.3%, a difference of 0.10%), Immigrants from Fiji (74.3%, a difference of 0.12%), Immigrants from Ireland (74.3%, a difference of 0.12%), and Immigrants from Ukraine (74.2%, a difference of 0.17%).
| Demographics | Rating | Rank | In Labor Force | Age 20-24 |
| Hispanics or Latinos | 7.9 /100 | #223 | Tragic 74.4% |
| Seminole | 6.9 /100 | #224 | Tragic 74.3% |
| Ghanaians | 6.2 /100 | #225 | Tragic 74.3% |
| Immigrants | Fiji | 5.9 /100 | #226 | Tragic 74.3% |
| Immigrants | Ireland | 5.8 /100 | #227 | Tragic 74.3% |
| Immigrants | Ukraine | 5.1 /100 | #228 | Tragic 74.2% |
| Immigrants | Sweden | 4.6 /100 | #229 | Tragic 74.2% |
| Immigrants | Albania | 4.3 /100 | #230 | Tragic 74.2% |
| Immigrants | Greece | 4.1 /100 | #231 | Tragic 74.2% |
| Immigrants | Switzerland | 4.1 /100 | #232 | Tragic 74.2% |
| Immigrants | Chile | 3.7 /100 | #233 | Tragic 74.1% |
| Immigrants | Immigrants | 3.6 /100 | #234 | Tragic 74.1% |
| Laotians | 3.5 /100 | #235 | Tragic 74.1% |
| Immigrants | France | 3.3 /100 | #236 | Tragic 74.1% |
| Bermudans | 3.2 /100 | #237 | Tragic 74.1% |
| Immigrants | Japan | 3.0 /100 | #238 | Tragic 74.1% |
| Immigrants | Latin America | 2.7 /100 | #239 | Tragic 74.1% |
| Immigrants | Sri Lanka | 2.3 /100 | #240 | Tragic 74.0% |
| Immigrants | Senegal | 2.1 /100 | #241 | Tragic 74.0% |
| Thais | 2.1 /100 | #242 | Tragic 74.0% |
| Immigrants | Syria | 1.9 /100 | #243 | Tragic 74.0% |