English vs Argentinean Disability Age 5 to 17
COMPARE
English
Argentinean
Disability Age 5 to 17
Disability Age 5 to 17 Comparison
English
Argentineans
6.2%
DISABILITY AGE 5 TO 17
0.0/ 100
METRIC RATING
285th/ 347
METRIC RANK
5.1%
DISABILITY AGE 5 TO 17
99.9/ 100
METRIC RATING
50th/ 347
METRIC RANK
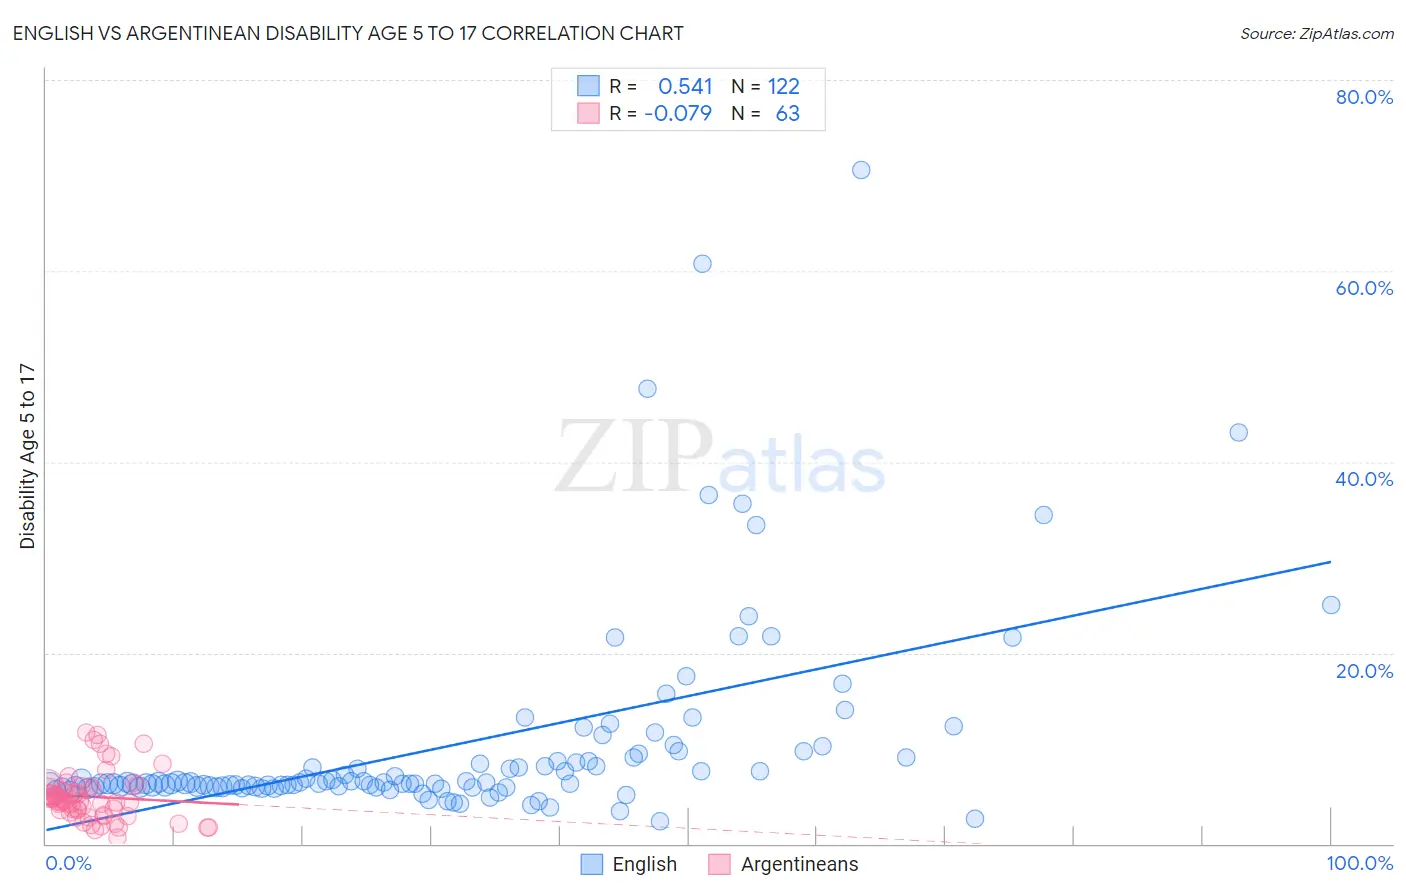
English vs Argentinean Disability Age 5 to 17 Correlation Chart
The statistical analysis conducted on geographies consisting of 563,308,437 people shows a substantial positive correlation between the proportion of English and percentage of population with a disability between the ages 5 and 17 in the United States with a correlation coefficient (R) of 0.541 and weighted average of 6.2%. Similarly, the statistical analysis conducted on geographies consisting of 295,397,898 people shows a slight negative correlation between the proportion of Argentineans and percentage of population with a disability between the ages 5 and 17 in the United States with a correlation coefficient (R) of -0.079 and weighted average of 5.1%, a difference of 21.1%.
Disability Age 5 to 17 Correlation Summary
| Measurement | English | Argentinean |
| Minimum | 2.4% | 0.71% |
| Maximum | 70.5% | 11.6% |
| Range | 68.2% | 10.9% |
| Mean | 10.4% | 4.9% |
| Median | 6.4% | 4.4% |
| Interquartile 25% (IQ1) | 6.0% | 3.3% |
| Interquartile 75% (IQ3) | 9.1% | 5.9% |
| Interquartile Range (IQR) | 3.1% | 2.7% |
| Standard Deviation (Sample) | 10.7% | 2.5% |
| Standard Deviation (Population) | 10.7% | 2.5% |
Similar Demographics by Disability Age 5 to 17
Demographics Similar to English by Disability Age 5 to 17
In terms of disability age 5 to 17, the demographic groups most similar to English are Subsaharan African (6.2%, a difference of 0.0%), Ugandan (6.2%, a difference of 0.030%), Colville (6.2%, a difference of 0.040%), German (6.1%, a difference of 0.19%), and Pima (6.2%, a difference of 0.23%).
| Demographics | Rating | Rank | Disability Age 5 to 17 |
| Immigrants | Liberia | 0.1 /100 | #278 | Tragic 6.1% |
| Immigrants | Jamaica | 0.1 /100 | #279 | Tragic 6.1% |
| Portuguese | 0.1 /100 | #280 | Tragic 6.1% |
| Scottish | 0.0 /100 | #281 | Tragic 6.1% |
| Germans | 0.0 /100 | #282 | Tragic 6.1% |
| Ugandans | 0.0 /100 | #283 | Tragic 6.2% |
| Sub-Saharan Africans | 0.0 /100 | #284 | Tragic 6.2% |
| English | 0.0 /100 | #285 | Tragic 6.2% |
| Colville | 0.0 /100 | #286 | Tragic 6.2% |
| Pima | 0.0 /100 | #287 | Tragic 6.2% |
| Jamaicans | 0.0 /100 | #288 | Tragic 6.2% |
| Yaqui | 0.0 /100 | #289 | Tragic 6.2% |
| Immigrants | Congo | 0.0 /100 | #290 | Tragic 6.2% |
| Whites/Caucasians | 0.0 /100 | #291 | Tragic 6.2% |
| Immigrants | Senegal | 0.0 /100 | #292 | Tragic 6.2% |
Demographics Similar to Argentineans by Disability Age 5 to 17
In terms of disability age 5 to 17, the demographic groups most similar to Argentineans are Turkish (5.1%, a difference of 0.29%), Immigrants from Fiji (5.1%, a difference of 0.38%), Immigrants from Western Asia (5.1%, a difference of 0.41%), Immigrants from Lithuania (5.1%, a difference of 0.44%), and Paraguayan (5.1%, a difference of 0.47%).
| Demographics | Rating | Rank | Disability Age 5 to 17 |
| Immigrants | Russia | 100.0 /100 | #43 | Exceptional 5.0% |
| Egyptians | 100.0 /100 | #44 | Exceptional 5.0% |
| Tongans | 100.0 /100 | #45 | Exceptional 5.0% |
| Assyrians/Chaldeans/Syriacs | 100.0 /100 | #46 | Exceptional 5.0% |
| Vietnamese | 100.0 /100 | #47 | Exceptional 5.1% |
| Koreans | 100.0 /100 | #48 | Exceptional 5.1% |
| Immigrants | Western Asia | 100.0 /100 | #49 | Exceptional 5.1% |
| Argentineans | 99.9 /100 | #50 | Exceptional 5.1% |
| Turks | 99.9 /100 | #51 | Exceptional 5.1% |
| Immigrants | Fiji | 99.9 /100 | #52 | Exceptional 5.1% |
| Immigrants | Lithuania | 99.9 /100 | #53 | Exceptional 5.1% |
| Paraguayans | 99.9 /100 | #54 | Exceptional 5.1% |
| Laotians | 99.9 /100 | #55 | Exceptional 5.1% |
| Immigrants | Turkey | 99.9 /100 | #56 | Exceptional 5.1% |
| Immigrants | Poland | 99.9 /100 | #57 | Exceptional 5.1% |