Immigrants from Sudan vs Marshallese Poverty
COMPARE
Immigrants from Sudan
Marshallese
Poverty
Poverty Comparison
Immigrants from Sudan
Marshallese
14.1%
POVERTY
0.3/ 100
METRIC RATING
245th/ 347
METRIC RANK
13.4%
POVERTY
2.2/ 100
METRIC RATING
226th/ 347
METRIC RANK
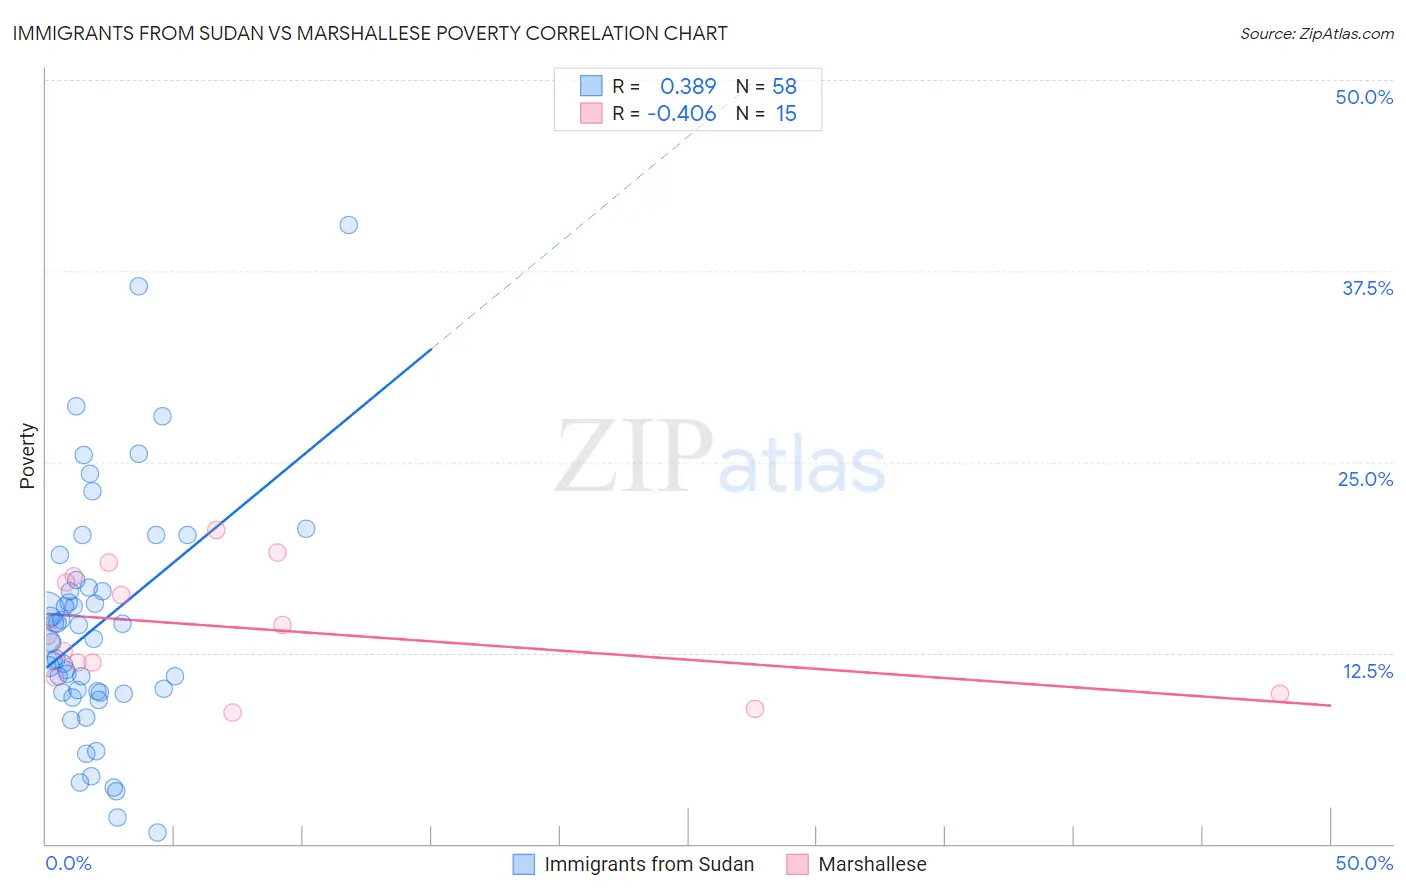
Immigrants from Sudan vs Marshallese Poverty Correlation Chart
The statistical analysis conducted on geographies consisting of 118,962,035 people shows a mild positive correlation between the proportion of Immigrants from Sudan and poverty level in the United States with a correlation coefficient (R) of 0.389 and weighted average of 14.1%. Similarly, the statistical analysis conducted on geographies consisting of 14,760,991 people shows a moderate negative correlation between the proportion of Marshallese and poverty level in the United States with a correlation coefficient (R) of -0.406 and weighted average of 13.4%, a difference of 4.6%.
Poverty Correlation Summary
| Measurement | Immigrants from Sudan | Marshallese |
| Minimum | 0.75% | 8.6% |
| Maximum | 40.5% | 20.5% |
| Range | 39.8% | 12.0% |
| Mean | 14.3% | 14.1% |
| Median | 13.4% | 13.7% |
| Interquartile 25% (IQ1) | 9.9% | 10.9% |
| Interquartile 75% (IQ3) | 16.8% | 17.5% |
| Interquartile Range (IQR) | 6.9% | 6.6% |
| Standard Deviation (Sample) | 7.8% | 3.9% |
| Standard Deviation (Population) | 7.7% | 3.7% |
Demographics Similar to Immigrants from Sudan and Marshallese by Poverty
In terms of poverty, the demographic groups most similar to Immigrants from Sudan are Nepalese (14.0%, a difference of 0.39%), Sudanese (14.0%, a difference of 0.42%), Ecuadorian (14.0%, a difference of 0.49%), Salvadoran (14.0%, a difference of 0.80%), and Immigrants from Middle Africa (14.0%, a difference of 0.83%). Similarly, the demographic groups most similar to Marshallese are German Russian (13.4%, a difference of 0.010%), Alaska Native (13.5%, a difference of 0.15%), Immigrants from Nigeria (13.5%, a difference of 0.60%), Osage (13.6%, a difference of 0.85%), and Alaskan Athabascan (13.6%, a difference of 0.90%).
| Demographics | Rating | Rank | Poverty |
| German Russians | 2.2 /100 | #225 | Tragic 13.4% |
| Marshallese | 2.2 /100 | #226 | Tragic 13.4% |
| Alaska Natives | 2.1 /100 | #227 | Tragic 13.5% |
| Immigrants | Nigeria | 1.7 /100 | #228 | Tragic 13.5% |
| Osage | 1.5 /100 | #229 | Tragic 13.6% |
| Alaskan Athabascans | 1.5 /100 | #230 | Tragic 13.6% |
| Nigerians | 1.4 /100 | #231 | Tragic 13.6% |
| Fijians | 0.8 /100 | #232 | Tragic 13.7% |
| Immigrants | Saudi Arabia | 0.8 /100 | #233 | Tragic 13.8% |
| Immigrants | Laos | 0.7 /100 | #234 | Tragic 13.8% |
| Cubans | 0.6 /100 | #235 | Tragic 13.9% |
| Immigrants | Armenia | 0.5 /100 | #236 | Tragic 13.9% |
| French American Indians | 0.5 /100 | #237 | Tragic 13.9% |
| Ghanaians | 0.5 /100 | #238 | Tragic 13.9% |
| Nicaraguans | 0.4 /100 | #239 | Tragic 13.9% |
| Immigrants | Middle Africa | 0.4 /100 | #240 | Tragic 14.0% |
| Salvadorans | 0.4 /100 | #241 | Tragic 14.0% |
| Ecuadorians | 0.4 /100 | #242 | Tragic 14.0% |
| Sudanese | 0.3 /100 | #243 | Tragic 14.0% |
| Nepalese | 0.3 /100 | #244 | Tragic 14.0% |
| Immigrants | Sudan | 0.3 /100 | #245 | Tragic 14.1% |