Immigrants from Sudan vs Slovene Male Disability
COMPARE
Immigrants from Sudan
Slovene
Male Disability
Male Disability Comparison
Immigrants from Sudan
Slovenes
11.0%
MALE DISABILITY
81.5/ 100
METRIC RATING
142nd/ 347
METRIC RANK
12.0%
MALE DISABILITY
0.5/ 100
METRIC RATING
252nd/ 347
METRIC RANK
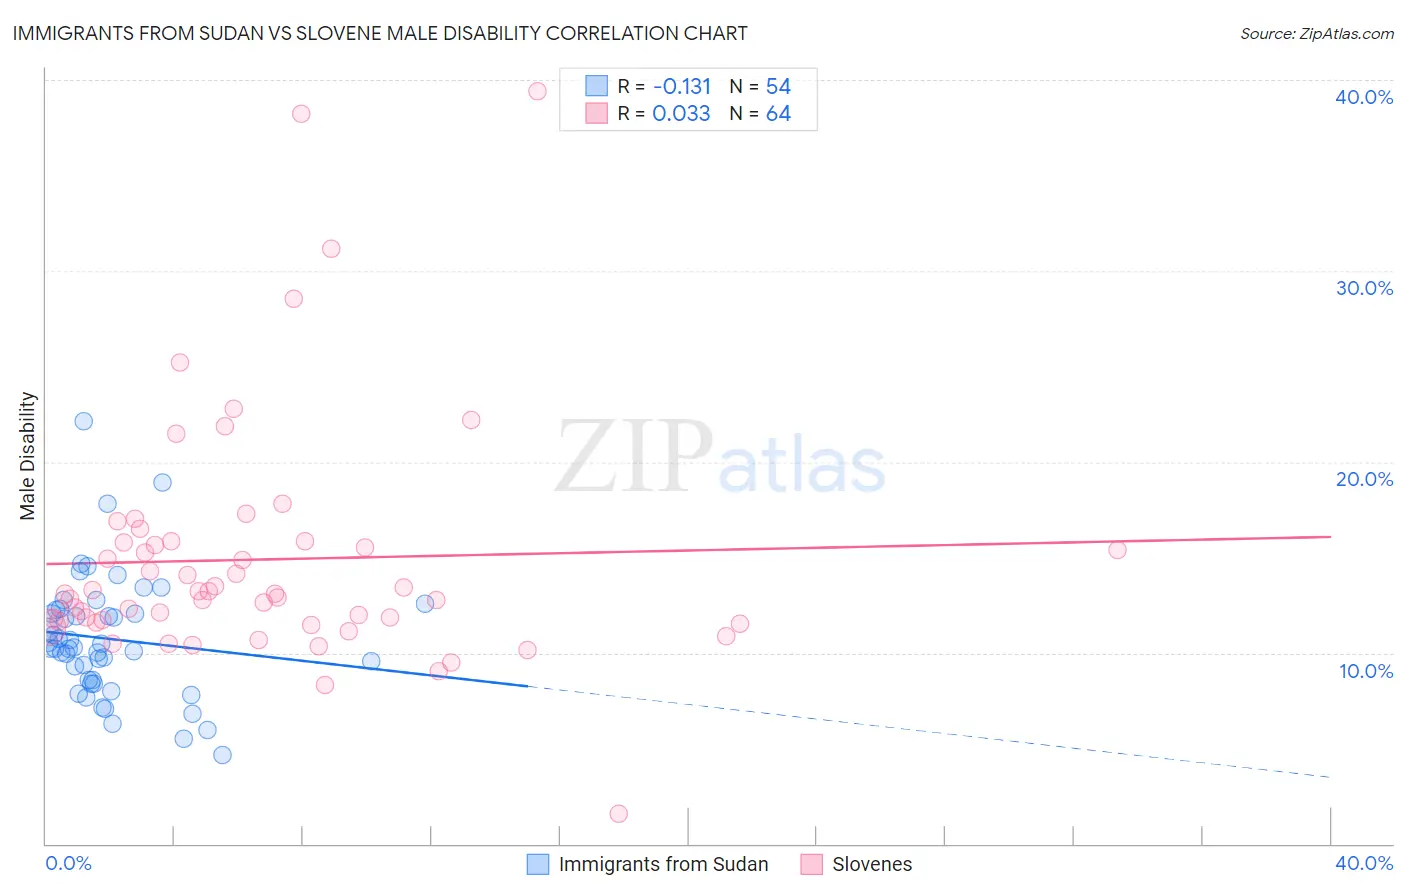
Immigrants from Sudan vs Slovene Male Disability Correlation Chart
The statistical analysis conducted on geographies consisting of 118,961,882 people shows a poor negative correlation between the proportion of Immigrants from Sudan and percentage of males with a disability in the United States with a correlation coefficient (R) of -0.131 and weighted average of 11.0%. Similarly, the statistical analysis conducted on geographies consisting of 261,347,999 people shows no correlation between the proportion of Slovenes and percentage of males with a disability in the United States with a correlation coefficient (R) of 0.033 and weighted average of 12.0%, a difference of 9.6%.
Male Disability Correlation Summary
| Measurement | Immigrants from Sudan | Slovene |
| Minimum | 4.7% | 1.6% |
| Maximum | 22.1% | 39.4% |
| Range | 17.5% | 37.8% |
| Mean | 10.7% | 14.9% |
| Median | 10.2% | 13.1% |
| Interquartile 25% (IQ1) | 8.6% | 11.6% |
| Interquartile 75% (IQ3) | 12.3% | 15.8% |
| Interquartile Range (IQR) | 3.7% | 4.2% |
| Standard Deviation (Sample) | 3.2% | 6.4% |
| Standard Deviation (Population) | 3.2% | 6.3% |
Similar Demographics by Male Disability
Demographics Similar to Immigrants from Sudan by Male Disability
In terms of male disability, the demographic groups most similar to Immigrants from Sudan are Immigrants from Italy (11.0%, a difference of 0.0%), Arab (11.0%, a difference of 0.0%), South African (11.0%, a difference of 0.020%), Nigerian (11.0%, a difference of 0.040%), and Immigrants from Europe (11.0%, a difference of 0.050%).
| Demographics | Rating | Rank | Male Disability |
| Trinidadians and Tobagonians | 83.3 /100 | #135 | Excellent 11.0% |
| Immigrants | Costa Rica | 82.8 /100 | #136 | Excellent 11.0% |
| Immigrants | Europe | 82.0 /100 | #137 | Excellent 11.0% |
| Nigerians | 81.9 /100 | #138 | Excellent 11.0% |
| South Africans | 81.7 /100 | #139 | Excellent 11.0% |
| Immigrants | Italy | 81.5 /100 | #140 | Excellent 11.0% |
| Arabs | 81.5 /100 | #141 | Excellent 11.0% |
| Immigrants | Sudan | 81.5 /100 | #142 | Excellent 11.0% |
| Moroccans | 80.7 /100 | #143 | Excellent 11.0% |
| Kenyans | 78.1 /100 | #144 | Good 11.0% |
| Costa Ricans | 78.0 /100 | #145 | Good 11.0% |
| Koreans | 77.5 /100 | #146 | Good 11.0% |
| Immigrants | Croatia | 77.3 /100 | #147 | Good 11.0% |
| Sudanese | 77.1 /100 | #148 | Good 11.0% |
| Immigrants | Denmark | 76.4 /100 | #149 | Good 11.0% |
Demographics Similar to Slovenes by Male Disability
In terms of male disability, the demographic groups most similar to Slovenes are Guamanian/Chamorro (12.0%, a difference of 0.0%), German Russian (12.0%, a difference of 0.070%), Bangladeshi (12.0%, a difference of 0.080%), Immigrants from Yemen (12.0%, a difference of 0.13%), and British (12.1%, a difference of 0.19%).
| Demographics | Rating | Rank | Male Disability |
| Immigrants | Liberia | 1.0 /100 | #245 | Tragic 11.9% |
| Danes | 0.9 /100 | #246 | Tragic 11.9% |
| Hungarians | 0.8 /100 | #247 | Tragic 12.0% |
| Poles | 0.7 /100 | #248 | Tragic 12.0% |
| Immigrants | Yemen | 0.5 /100 | #249 | Tragic 12.0% |
| Bangladeshis | 0.5 /100 | #250 | Tragic 12.0% |
| German Russians | 0.5 /100 | #251 | Tragic 12.0% |
| Slovenes | 0.5 /100 | #252 | Tragic 12.0% |
| Guamanians/Chamorros | 0.5 /100 | #253 | Tragic 12.0% |
| British | 0.4 /100 | #254 | Tragic 12.1% |
| Chinese | 0.4 /100 | #255 | Tragic 12.1% |
| Swiss | 0.3 /100 | #256 | Tragic 12.1% |
| Europeans | 0.3 /100 | #257 | Tragic 12.1% |
| Basques | 0.3 /100 | #258 | Tragic 12.1% |
| Belgians | 0.3 /100 | #259 | Tragic 12.1% |