Cajun vs Belizean Disability Age 5 to 17
COMPARE
Cajun
Belizean
Disability Age 5 to 17
Disability Age 5 to 17 Comparison
Cajuns
Belizeans
7.2%
DISABILITY AGE 5 TO 17
0.0/ 100
METRIC RATING
344th/ 347
METRIC RANK
5.4%
DISABILITY AGE 5 TO 17
90.8/ 100
METRIC RATING
139th/ 347
METRIC RANK
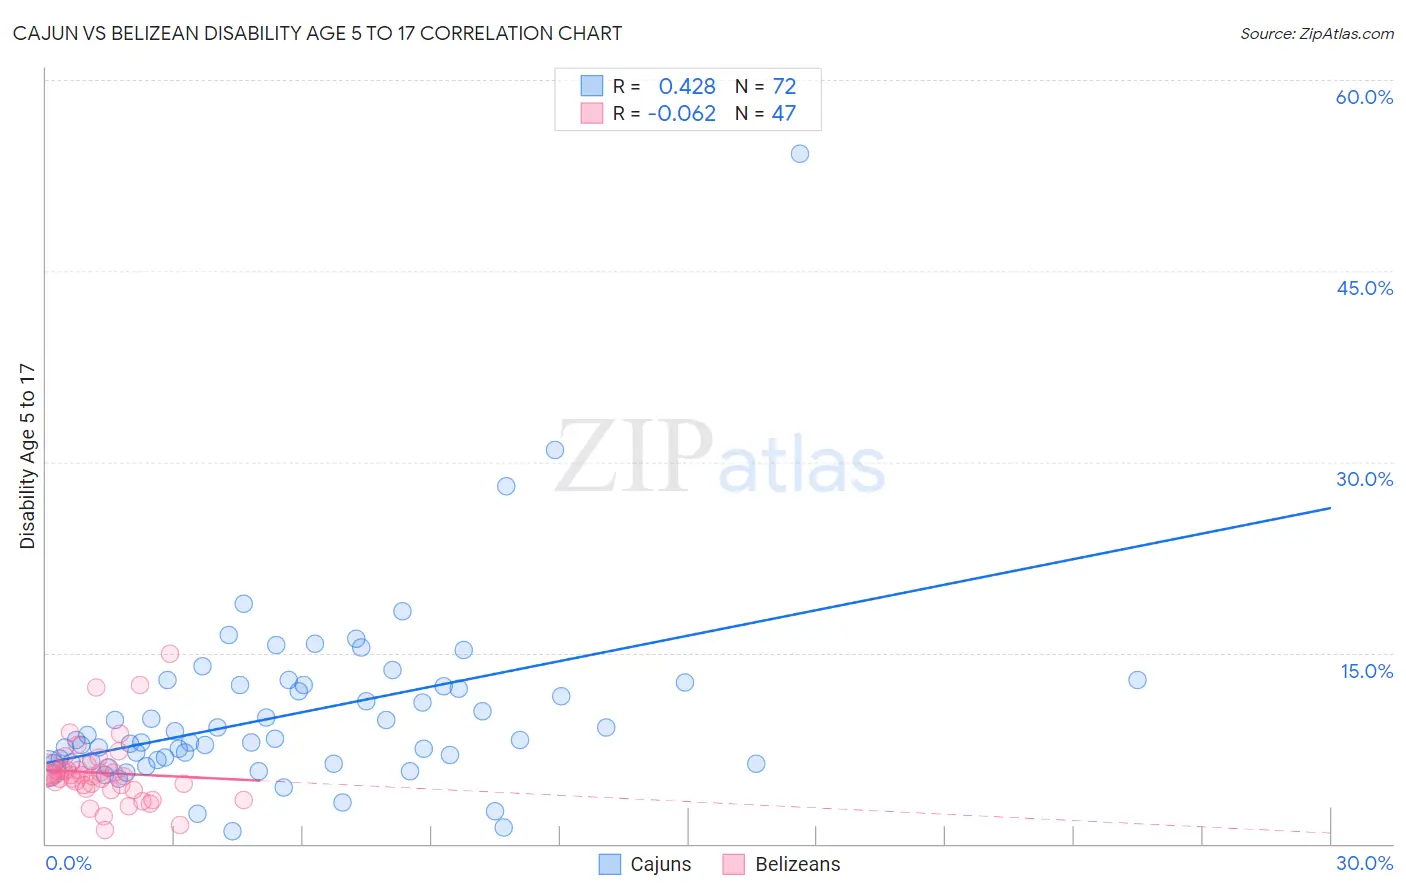
Cajun vs Belizean Disability Age 5 to 17 Correlation Chart
The statistical analysis conducted on geographies consisting of 149,070,842 people shows a moderate positive correlation between the proportion of Cajuns and percentage of population with a disability between the ages 5 and 17 in the United States with a correlation coefficient (R) of 0.428 and weighted average of 7.2%. Similarly, the statistical analysis conducted on geographies consisting of 143,880,682 people shows a slight negative correlation between the proportion of Belizeans and percentage of population with a disability between the ages 5 and 17 in the United States with a correlation coefficient (R) of -0.062 and weighted average of 5.4%, a difference of 32.0%.
Disability Age 5 to 17 Correlation Summary
| Measurement | Cajun | Belizean |
| Minimum | 0.98% | 1.1% |
| Maximum | 54.2% | 14.9% |
| Range | 53.2% | 13.9% |
| Mean | 10.3% | 5.6% |
| Median | 8.2% | 5.4% |
| Interquartile 25% (IQ1) | 6.4% | 4.3% |
| Interquartile 75% (IQ3) | 12.5% | 5.9% |
| Interquartile Range (IQR) | 6.1% | 1.5% |
| Standard Deviation (Sample) | 7.4% | 2.6% |
| Standard Deviation (Population) | 7.3% | 2.5% |
Similar Demographics by Disability Age 5 to 17
Demographics Similar to Cajuns by Disability Age 5 to 17
In terms of disability age 5 to 17, the demographic groups most similar to Cajuns are Immigrants from Cabo Verde (7.1%, a difference of 0.70%), Chippewa (7.1%, a difference of 0.96%), Cape Verdean (7.0%, a difference of 3.2%), Cherokee (6.9%, a difference of 3.7%), and Choctaw (6.9%, a difference of 4.0%).
| Demographics | Rating | Rank | Disability Age 5 to 17 |
| Blacks/African Americans | 0.0 /100 | #333 | Tragic 6.8% |
| Seminole | 0.0 /100 | #334 | Tragic 6.8% |
| Ottawa | 0.0 /100 | #335 | Tragic 6.8% |
| Chickasaw | 0.0 /100 | #336 | Tragic 6.8% |
| Creek | 0.0 /100 | #337 | Tragic 6.9% |
| Iroquois | 0.0 /100 | #338 | Tragic 6.9% |
| Choctaw | 0.0 /100 | #339 | Tragic 6.9% |
| Cherokee | 0.0 /100 | #340 | Tragic 6.9% |
| Cape Verdeans | 0.0 /100 | #341 | Tragic 7.0% |
| Chippewa | 0.0 /100 | #342 | Tragic 7.1% |
| Immigrants | Cabo Verde | 0.0 /100 | #343 | Tragic 7.1% |
| Cajuns | 0.0 /100 | #344 | Tragic 7.2% |
| Tsimshian | 0.0 /100 | #345 | Tragic 7.9% |
| Puerto Ricans | 0.0 /100 | #346 | Tragic 8.3% |
| Houma | 0.0 /100 | #347 | Tragic 9.1% |
Demographics Similar to Belizeans by Disability Age 5 to 17
In terms of disability age 5 to 17, the demographic groups most similar to Belizeans are Immigrants from Oceania (5.4%, a difference of 0.0%), Navajo (5.4%, a difference of 0.010%), Immigrants from Netherlands (5.4%, a difference of 0.050%), Immigrants from Denmark (5.4%, a difference of 0.090%), and Immigrants from Belize (5.4%, a difference of 0.14%).
| Demographics | Rating | Rank | Disability Age 5 to 17 |
| Immigrants | Colombia | 92.9 /100 | #132 | Exceptional 5.4% |
| Venezuelans | 92.7 /100 | #133 | Exceptional 5.4% |
| Yuman | 92.3 /100 | #134 | Exceptional 5.4% |
| Immigrants | Belize | 91.7 /100 | #135 | Exceptional 5.4% |
| Immigrants | Denmark | 91.4 /100 | #136 | Exceptional 5.4% |
| Navajo | 90.9 /100 | #137 | Exceptional 5.4% |
| Immigrants | Oceania | 90.8 /100 | #138 | Exceptional 5.4% |
| Belizeans | 90.8 /100 | #139 | Exceptional 5.4% |
| Immigrants | Netherlands | 90.5 /100 | #140 | Exceptional 5.4% |
| South American Indians | 89.3 /100 | #141 | Excellent 5.5% |
| Colombians | 88.0 /100 | #142 | Excellent 5.5% |
| Immigrants | Hungary | 87.9 /100 | #143 | Excellent 5.5% |
| Pakistanis | 87.3 /100 | #144 | Excellent 5.5% |
| Immigrants | Guatemala | 86.6 /100 | #145 | Excellent 5.5% |
| Albanians | 83.7 /100 | #146 | Excellent 5.5% |