Immigrants from Spain vs Tsimshian Male Disability
COMPARE
Immigrants from Spain
Tsimshian
Male Disability
Male Disability Comparison
Immigrants from Spain
Tsimshian
10.3%
MALE DISABILITY
99.7/ 100
METRIC RATING
49th/ 347
METRIC RANK
15.6%
MALE DISABILITY
0.0/ 100
METRIC RATING
345th/ 347
METRIC RANK
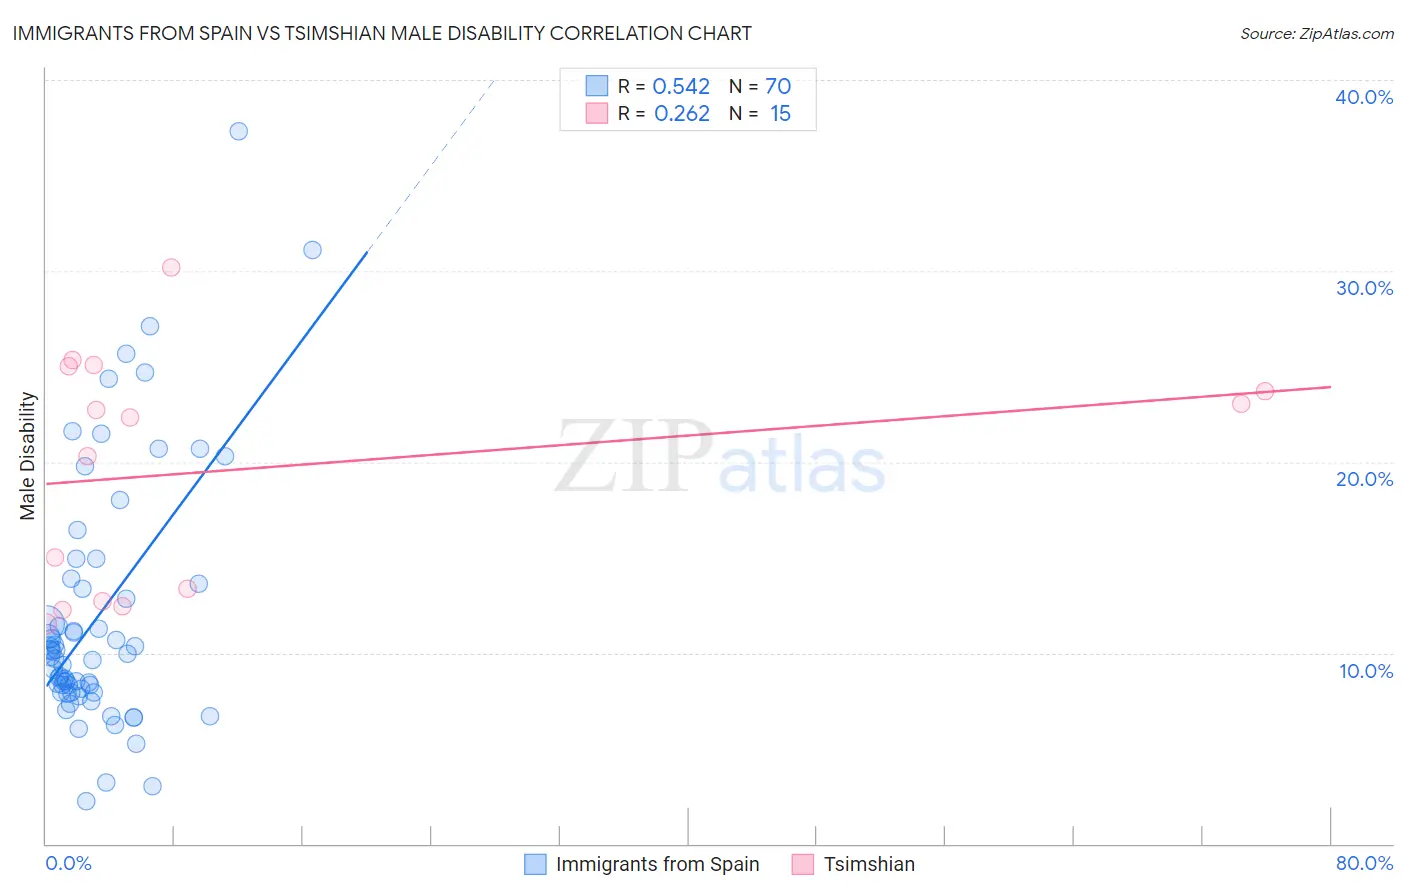
Immigrants from Spain vs Tsimshian Male Disability Correlation Chart
The statistical analysis conducted on geographies consisting of 239,682,902 people shows a substantial positive correlation between the proportion of Immigrants from Spain and percentage of males with a disability in the United States with a correlation coefficient (R) of 0.542 and weighted average of 10.3%. Similarly, the statistical analysis conducted on geographies consisting of 15,626,544 people shows a weak positive correlation between the proportion of Tsimshian and percentage of males with a disability in the United States with a correlation coefficient (R) of 0.262 and weighted average of 15.6%, a difference of 51.1%.
Male Disability Correlation Summary
| Measurement | Immigrants from Spain | Tsimshian |
| Minimum | 2.2% | 11.5% |
| Maximum | 37.3% | 30.2% |
| Range | 35.1% | 18.6% |
| Mean | 11.9% | 19.7% |
| Median | 9.9% | 22.4% |
| Interquartile 25% (IQ1) | 7.9% | 12.7% |
| Interquartile 75% (IQ3) | 13.6% | 25.0% |
| Interquartile Range (IQR) | 5.7% | 12.3% |
| Standard Deviation (Sample) | 6.7% | 6.1% |
| Standard Deviation (Population) | 6.7% | 5.9% |
Similar Demographics by Male Disability
Demographics Similar to Immigrants from Spain by Male Disability
In terms of male disability, the demographic groups most similar to Immigrants from Spain are Israeli (10.3%, a difference of 0.060%), Immigrants from Peru (10.3%, a difference of 0.090%), Cambodian (10.3%, a difference of 0.13%), South American (10.3%, a difference of 0.13%), and Immigrants from El Salvador (10.3%, a difference of 0.21%).
| Demographics | Rating | Rank | Male Disability |
| Mongolians | 99.7 /100 | #42 | Exceptional 10.3% |
| Immigrants | Bangladesh | 99.7 /100 | #43 | Exceptional 10.3% |
| Immigrants | El Salvador | 99.7 /100 | #44 | Exceptional 10.3% |
| Turks | 99.7 /100 | #45 | Exceptional 10.3% |
| Cambodians | 99.7 /100 | #46 | Exceptional 10.3% |
| Immigrants | Peru | 99.7 /100 | #47 | Exceptional 10.3% |
| Israelis | 99.7 /100 | #48 | Exceptional 10.3% |
| Immigrants | Spain | 99.7 /100 | #49 | Exceptional 10.3% |
| South Americans | 99.6 /100 | #50 | Exceptional 10.3% |
| Salvadorans | 99.6 /100 | #51 | Exceptional 10.4% |
| Immigrants | Saudi Arabia | 99.6 /100 | #52 | Exceptional 10.4% |
| Immigrants | Uzbekistan | 99.6 /100 | #53 | Exceptional 10.4% |
| Peruvians | 99.6 /100 | #54 | Exceptional 10.4% |
| Immigrants | Eritrea | 99.6 /100 | #55 | Exceptional 10.4% |
| Tongans | 99.6 /100 | #56 | Exceptional 10.4% |
Demographics Similar to Tsimshian by Male Disability
In terms of male disability, the demographic groups most similar to Tsimshian are Puerto Rican (15.6%, a difference of 0.32%), Creek (15.5%, a difference of 0.45%), Kiowa (15.4%, a difference of 1.1%), Choctaw (15.4%, a difference of 1.3%), and Lumbee (15.2%, a difference of 2.4%).
| Demographics | Rating | Rank | Male Disability |
| Yuman | 0.0 /100 | #333 | Tragic 14.7% |
| Cherokee | 0.0 /100 | #334 | Tragic 14.8% |
| Dutch West Indians | 0.0 /100 | #335 | Tragic 14.8% |
| Alaskan Athabascans | 0.0 /100 | #336 | Tragic 14.9% |
| Menominee | 0.0 /100 | #337 | Tragic 15.0% |
| Pueblo | 0.0 /100 | #338 | Tragic 15.0% |
| Chickasaw | 0.0 /100 | #339 | Tragic 15.1% |
| Lumbee | 0.0 /100 | #340 | Tragic 15.2% |
| Choctaw | 0.0 /100 | #341 | Tragic 15.4% |
| Kiowa | 0.0 /100 | #342 | Tragic 15.4% |
| Creek | 0.0 /100 | #343 | Tragic 15.5% |
| Puerto Ricans | 0.0 /100 | #344 | Tragic 15.6% |
| Tsimshian | 0.0 /100 | #345 | Tragic 15.6% |
| Colville | 0.0 /100 | #346 | Tragic 16.5% |
| Houma | 0.0 /100 | #347 | Tragic 17.4% |