Immigrants from Austria vs Tsimshian Male Disability
COMPARE
Immigrants from Austria
Tsimshian
Male Disability
Male Disability Comparison
Immigrants from Austria
Tsimshian
11.4%
MALE DISABILITY
27.3/ 100
METRIC RATING
187th/ 347
METRIC RANK
15.6%
MALE DISABILITY
0.0/ 100
METRIC RATING
345th/ 347
METRIC RANK
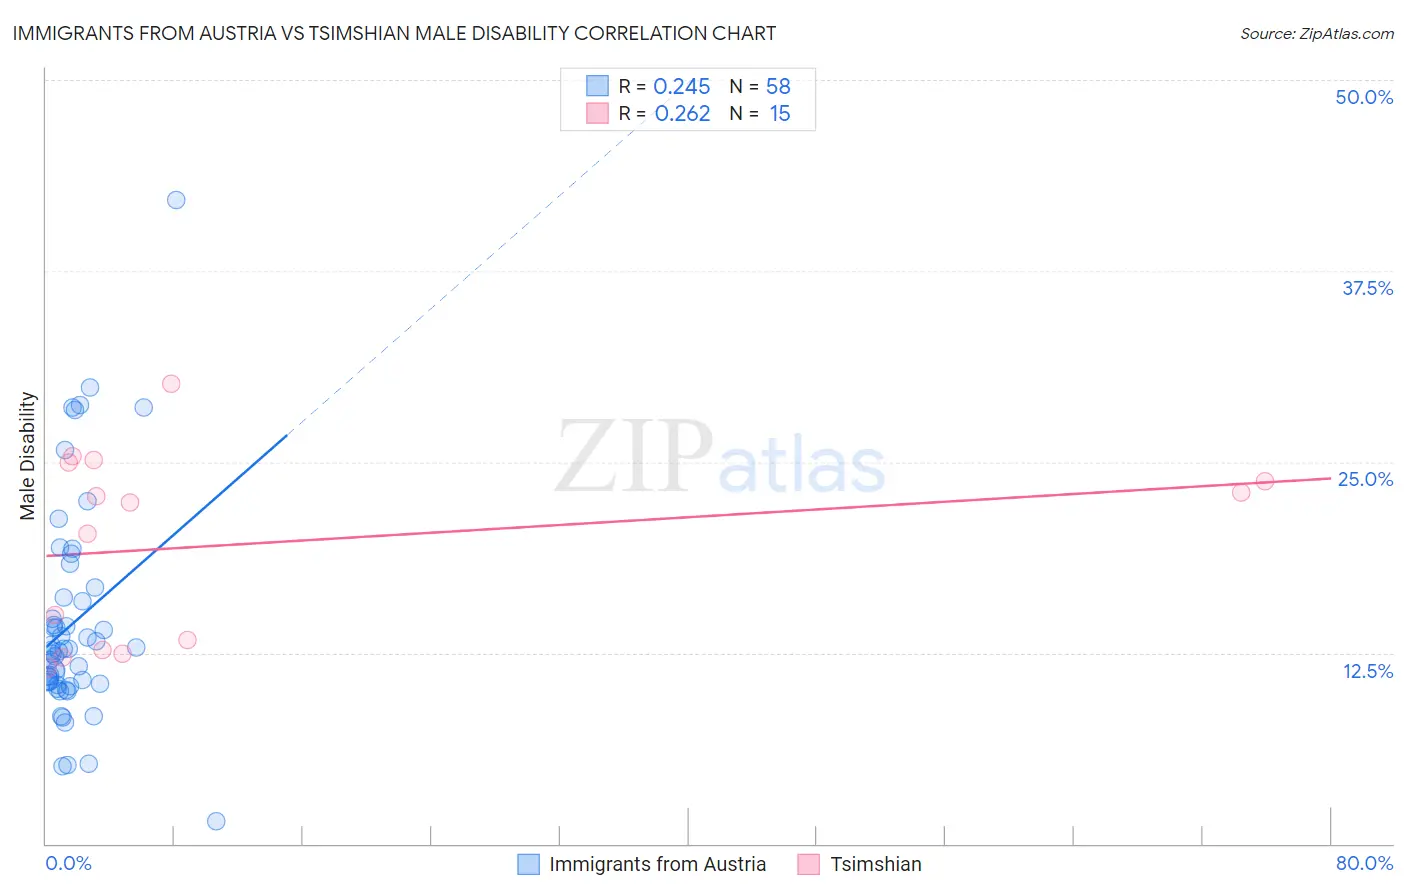
Immigrants from Austria vs Tsimshian Male Disability Correlation Chart
The statistical analysis conducted on geographies consisting of 167,973,228 people shows a weak positive correlation between the proportion of Immigrants from Austria and percentage of males with a disability in the United States with a correlation coefficient (R) of 0.245 and weighted average of 11.4%. Similarly, the statistical analysis conducted on geographies consisting of 15,626,544 people shows a weak positive correlation between the proportion of Tsimshian and percentage of males with a disability in the United States with a correlation coefficient (R) of 0.262 and weighted average of 15.6%, a difference of 37.2%.
Male Disability Correlation Summary
| Measurement | Immigrants from Austria | Tsimshian |
| Minimum | 1.4% | 11.5% |
| Maximum | 42.1% | 30.2% |
| Range | 40.7% | 18.6% |
| Mean | 14.5% | 19.7% |
| Median | 12.7% | 22.4% |
| Interquartile 25% (IQ1) | 10.5% | 12.7% |
| Interquartile 75% (IQ3) | 16.1% | 25.0% |
| Interquartile Range (IQR) | 5.7% | 12.3% |
| Standard Deviation (Sample) | 7.2% | 6.1% |
| Standard Deviation (Population) | 7.2% | 5.9% |
Similar Demographics by Male Disability
Demographics Similar to Immigrants from Austria by Male Disability
In terms of male disability, the demographic groups most similar to Immigrants from Austria are Immigrants from Zaire (11.4%, a difference of 0.020%), Estonian (11.4%, a difference of 0.040%), Immigrants from Netherlands (11.4%, a difference of 0.10%), Immigrants from Bosnia and Herzegovina (11.4%, a difference of 0.14%), and Pakistani (11.3%, a difference of 0.20%).
| Demographics | Rating | Rank | Male Disability |
| Hondurans | 41.1 /100 | #180 | Average 11.3% |
| Immigrants | Senegal | 34.4 /100 | #181 | Fair 11.3% |
| Immigrants | Belize | 33.7 /100 | #182 | Fair 11.3% |
| Immigrants | Central America | 32.9 /100 | #183 | Fair 11.3% |
| Iraqis | 30.5 /100 | #184 | Fair 11.3% |
| Pakistanis | 30.3 /100 | #185 | Fair 11.3% |
| Immigrants | Zaire | 27.6 /100 | #186 | Fair 11.4% |
| Immigrants | Austria | 27.3 /100 | #187 | Fair 11.4% |
| Estonians | 26.8 /100 | #188 | Fair 11.4% |
| Immigrants | Netherlands | 25.9 /100 | #189 | Fair 11.4% |
| Immigrants | Bosnia and Herzegovina | 25.4 /100 | #190 | Fair 11.4% |
| Senegalese | 23.2 /100 | #191 | Fair 11.4% |
| Assyrians/Chaldeans/Syriacs | 23.2 /100 | #192 | Fair 11.4% |
| Greeks | 22.2 /100 | #193 | Fair 11.4% |
| Belizeans | 21.2 /100 | #194 | Fair 11.4% |
Demographics Similar to Tsimshian by Male Disability
In terms of male disability, the demographic groups most similar to Tsimshian are Puerto Rican (15.6%, a difference of 0.32%), Creek (15.5%, a difference of 0.45%), Kiowa (15.4%, a difference of 1.1%), Choctaw (15.4%, a difference of 1.3%), and Lumbee (15.2%, a difference of 2.4%).
| Demographics | Rating | Rank | Male Disability |
| Yuman | 0.0 /100 | #333 | Tragic 14.7% |
| Cherokee | 0.0 /100 | #334 | Tragic 14.8% |
| Dutch West Indians | 0.0 /100 | #335 | Tragic 14.8% |
| Alaskan Athabascans | 0.0 /100 | #336 | Tragic 14.9% |
| Menominee | 0.0 /100 | #337 | Tragic 15.0% |
| Pueblo | 0.0 /100 | #338 | Tragic 15.0% |
| Chickasaw | 0.0 /100 | #339 | Tragic 15.1% |
| Lumbee | 0.0 /100 | #340 | Tragic 15.2% |
| Choctaw | 0.0 /100 | #341 | Tragic 15.4% |
| Kiowa | 0.0 /100 | #342 | Tragic 15.4% |
| Creek | 0.0 /100 | #343 | Tragic 15.5% |
| Puerto Ricans | 0.0 /100 | #344 | Tragic 15.6% |
| Tsimshian | 0.0 /100 | #345 | Tragic 15.6% |
| Colville | 0.0 /100 | #346 | Tragic 16.5% |
| Houma | 0.0 /100 | #347 | Tragic 17.4% |