Immigrants from Spain vs Immigrants from Australia Male Disability
COMPARE
Immigrants from Spain
Immigrants from Australia
Male Disability
Male Disability Comparison
Immigrants from Spain
Immigrants from Australia
10.3%
MALE DISABILITY
99.7/ 100
METRIC RATING
49th/ 347
METRIC RANK
10.4%
MALE DISABILITY
99.5/ 100
METRIC RATING
59th/ 347
METRIC RANK
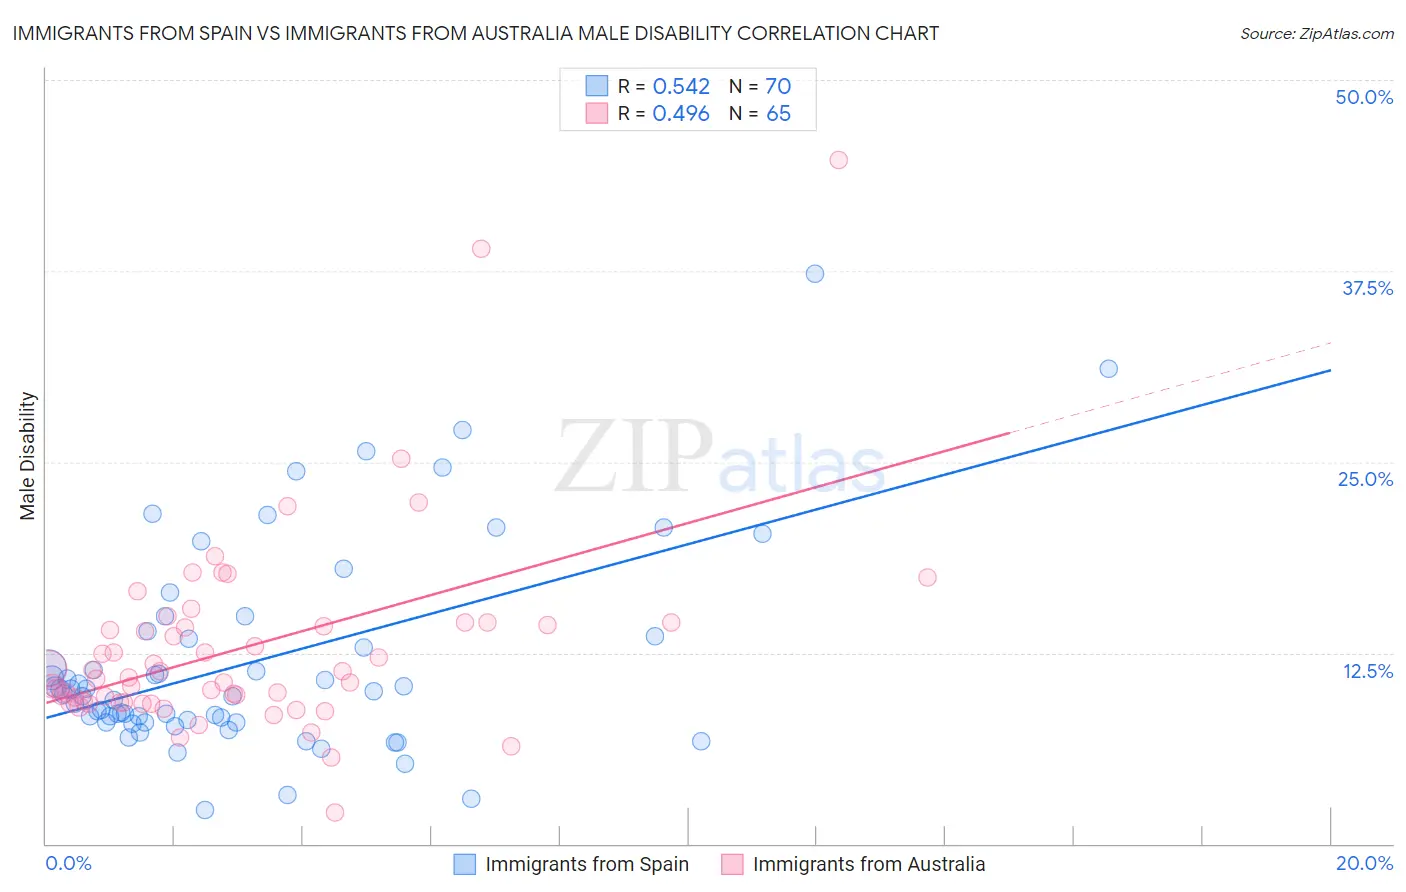
Immigrants from Spain vs Immigrants from Australia Male Disability Correlation Chart
The statistical analysis conducted on geographies consisting of 239,682,902 people shows a substantial positive correlation between the proportion of Immigrants from Spain and percentage of males with a disability in the United States with a correlation coefficient (R) of 0.542 and weighted average of 10.3%. Similarly, the statistical analysis conducted on geographies consisting of 227,204,405 people shows a moderate positive correlation between the proportion of Immigrants from Australia and percentage of males with a disability in the United States with a correlation coefficient (R) of 0.496 and weighted average of 10.4%, a difference of 0.70%.
Male Disability Correlation Summary
| Measurement | Immigrants from Spain | Immigrants from Australia |
| Minimum | 2.2% | 2.0% |
| Maximum | 37.3% | 44.7% |
| Range | 35.1% | 42.7% |
| Mean | 11.9% | 12.8% |
| Median | 9.9% | 10.9% |
| Interquartile 25% (IQ1) | 7.9% | 9.2% |
| Interquartile 75% (IQ3) | 13.6% | 14.4% |
| Interquartile Range (IQR) | 5.7% | 5.2% |
| Standard Deviation (Sample) | 6.7% | 6.6% |
| Standard Deviation (Population) | 6.7% | 6.6% |
Demographics Similar to Immigrants from Spain and Immigrants from Australia by Male Disability
In terms of male disability, the demographic groups most similar to Immigrants from Spain are Israeli (10.3%, a difference of 0.060%), Immigrants from Peru (10.3%, a difference of 0.090%), Cambodian (10.3%, a difference of 0.13%), South American (10.3%, a difference of 0.13%), and Immigrants from El Salvador (10.3%, a difference of 0.21%). Similarly, the demographic groups most similar to Immigrants from Australia are Immigrants from Colombia (10.4%, a difference of 0.060%), Immigrants from Japan (10.4%, a difference of 0.14%), Immigrants from Northern Africa (10.4%, a difference of 0.15%), Immigrants from South America (10.4%, a difference of 0.22%), and Tongan (10.4%, a difference of 0.24%).
| Demographics | Rating | Rank | Male Disability |
| Immigrants | El Salvador | 99.7 /100 | #44 | Exceptional 10.3% |
| Turks | 99.7 /100 | #45 | Exceptional 10.3% |
| Cambodians | 99.7 /100 | #46 | Exceptional 10.3% |
| Immigrants | Peru | 99.7 /100 | #47 | Exceptional 10.3% |
| Israelis | 99.7 /100 | #48 | Exceptional 10.3% |
| Immigrants | Spain | 99.7 /100 | #49 | Exceptional 10.3% |
| South Americans | 99.6 /100 | #50 | Exceptional 10.3% |
| Salvadorans | 99.6 /100 | #51 | Exceptional 10.4% |
| Immigrants | Saudi Arabia | 99.6 /100 | #52 | Exceptional 10.4% |
| Immigrants | Uzbekistan | 99.6 /100 | #53 | Exceptional 10.4% |
| Peruvians | 99.6 /100 | #54 | Exceptional 10.4% |
| Immigrants | Eritrea | 99.6 /100 | #55 | Exceptional 10.4% |
| Tongans | 99.6 /100 | #56 | Exceptional 10.4% |
| Immigrants | South America | 99.6 /100 | #57 | Exceptional 10.4% |
| Immigrants | Japan | 99.5 /100 | #58 | Exceptional 10.4% |
| Immigrants | Australia | 99.5 /100 | #59 | Exceptional 10.4% |
| Immigrants | Colombia | 99.5 /100 | #60 | Exceptional 10.4% |
| Immigrants | Northern Africa | 99.4 /100 | #61 | Exceptional 10.4% |
| Immigrants | Ecuador | 99.3 /100 | #62 | Exceptional 10.4% |
| Immigrants | Belarus | 99.3 /100 | #63 | Exceptional 10.4% |
| Jordanians | 99.3 /100 | #64 | Exceptional 10.5% |