Immigrants from Spain vs Bolivian Male Disability
COMPARE
Immigrants from Spain
Bolivian
Male Disability
Male Disability Comparison
Immigrants from Spain
Bolivians
10.3%
MALE DISABILITY
99.7/ 100
METRIC RATING
49th/ 347
METRIC RANK
9.6%
MALE DISABILITY
100.0/ 100
METRIC RATING
12th/ 347
METRIC RANK
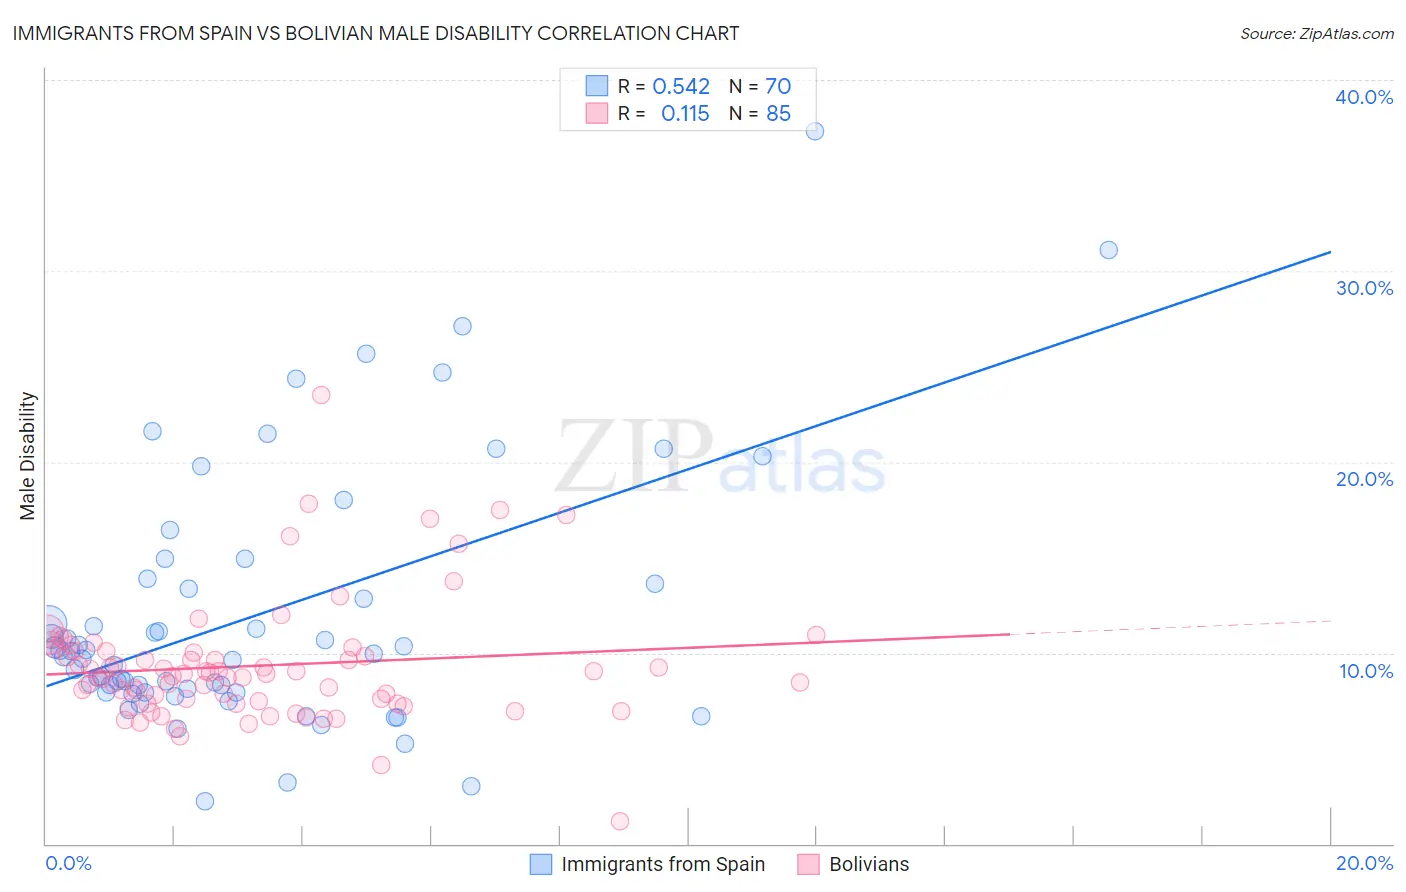
Immigrants from Spain vs Bolivian Male Disability Correlation Chart
The statistical analysis conducted on geographies consisting of 239,682,902 people shows a substantial positive correlation between the proportion of Immigrants from Spain and percentage of males with a disability in the United States with a correlation coefficient (R) of 0.542 and weighted average of 10.3%. Similarly, the statistical analysis conducted on geographies consisting of 184,652,899 people shows a poor positive correlation between the proportion of Bolivians and percentage of males with a disability in the United States with a correlation coefficient (R) of 0.115 and weighted average of 9.6%, a difference of 7.1%.
Male Disability Correlation Summary
| Measurement | Immigrants from Spain | Bolivian |
| Minimum | 2.2% | 1.2% |
| Maximum | 37.3% | 23.5% |
| Range | 35.1% | 22.3% |
| Mean | 11.9% | 9.3% |
| Median | 9.9% | 8.9% |
| Interquartile 25% (IQ1) | 7.9% | 7.4% |
| Interquartile 75% (IQ3) | 13.6% | 10.1% |
| Interquartile Range (IQR) | 5.7% | 2.7% |
| Standard Deviation (Sample) | 6.7% | 3.2% |
| Standard Deviation (Population) | 6.7% | 3.2% |
Similar Demographics by Male Disability
Demographics Similar to Immigrants from Spain by Male Disability
In terms of male disability, the demographic groups most similar to Immigrants from Spain are Israeli (10.3%, a difference of 0.060%), Immigrants from Peru (10.3%, a difference of 0.090%), Cambodian (10.3%, a difference of 0.13%), South American (10.3%, a difference of 0.13%), and Immigrants from El Salvador (10.3%, a difference of 0.21%).
| Demographics | Rating | Rank | Male Disability |
| Mongolians | 99.7 /100 | #42 | Exceptional 10.3% |
| Immigrants | Bangladesh | 99.7 /100 | #43 | Exceptional 10.3% |
| Immigrants | El Salvador | 99.7 /100 | #44 | Exceptional 10.3% |
| Turks | 99.7 /100 | #45 | Exceptional 10.3% |
| Cambodians | 99.7 /100 | #46 | Exceptional 10.3% |
| Immigrants | Peru | 99.7 /100 | #47 | Exceptional 10.3% |
| Israelis | 99.7 /100 | #48 | Exceptional 10.3% |
| Immigrants | Spain | 99.7 /100 | #49 | Exceptional 10.3% |
| South Americans | 99.6 /100 | #50 | Exceptional 10.3% |
| Salvadorans | 99.6 /100 | #51 | Exceptional 10.4% |
| Immigrants | Saudi Arabia | 99.6 /100 | #52 | Exceptional 10.4% |
| Immigrants | Uzbekistan | 99.6 /100 | #53 | Exceptional 10.4% |
| Peruvians | 99.6 /100 | #54 | Exceptional 10.4% |
| Immigrants | Eritrea | 99.6 /100 | #55 | Exceptional 10.4% |
| Tongans | 99.6 /100 | #56 | Exceptional 10.4% |
Demographics Similar to Bolivians by Male Disability
In terms of male disability, the demographic groups most similar to Bolivians are Iranian (9.7%, a difference of 0.23%), Immigrants from Eastern Asia (9.6%, a difference of 0.24%), Immigrants from Iran (9.7%, a difference of 0.33%), Indian (Asian) (9.7%, a difference of 0.78%), and Immigrants from Israel (9.6%, a difference of 0.79%).
| Demographics | Rating | Rank | Male Disability |
| Immigrants | Hong Kong | 100.0 /100 | #5 | Exceptional 9.4% |
| Immigrants | South Central Asia | 100.0 /100 | #6 | Exceptional 9.4% |
| Immigrants | Bolivia | 100.0 /100 | #7 | Exceptional 9.5% |
| Immigrants | China | 100.0 /100 | #8 | Exceptional 9.5% |
| Immigrants | Singapore | 100.0 /100 | #9 | Exceptional 9.5% |
| Immigrants | Israel | 100.0 /100 | #10 | Exceptional 9.6% |
| Immigrants | Eastern Asia | 100.0 /100 | #11 | Exceptional 9.6% |
| Bolivians | 100.0 /100 | #12 | Exceptional 9.6% |
| Iranians | 100.0 /100 | #13 | Exceptional 9.7% |
| Immigrants | Iran | 100.0 /100 | #14 | Exceptional 9.7% |
| Indians (Asian) | 100.0 /100 | #15 | Exceptional 9.7% |
| Okinawans | 100.0 /100 | #16 | Exceptional 9.8% |
| Immigrants | Korea | 100.0 /100 | #17 | Exceptional 9.8% |
| Immigrants | Pakistan | 100.0 /100 | #18 | Exceptional 9.8% |
| Immigrants | Sri Lanka | 100.0 /100 | #19 | Exceptional 10.0% |