Immigrants from Spain vs Dominican Male Disability
COMPARE
Immigrants from Spain
Dominican
Male Disability
Male Disability Comparison
Immigrants from Spain
Dominicans
10.3%
MALE DISABILITY
99.7/ 100
METRIC RATING
49th/ 347
METRIC RANK
11.8%
MALE DISABILITY
1.8/ 100
METRIC RATING
231st/ 347
METRIC RANK
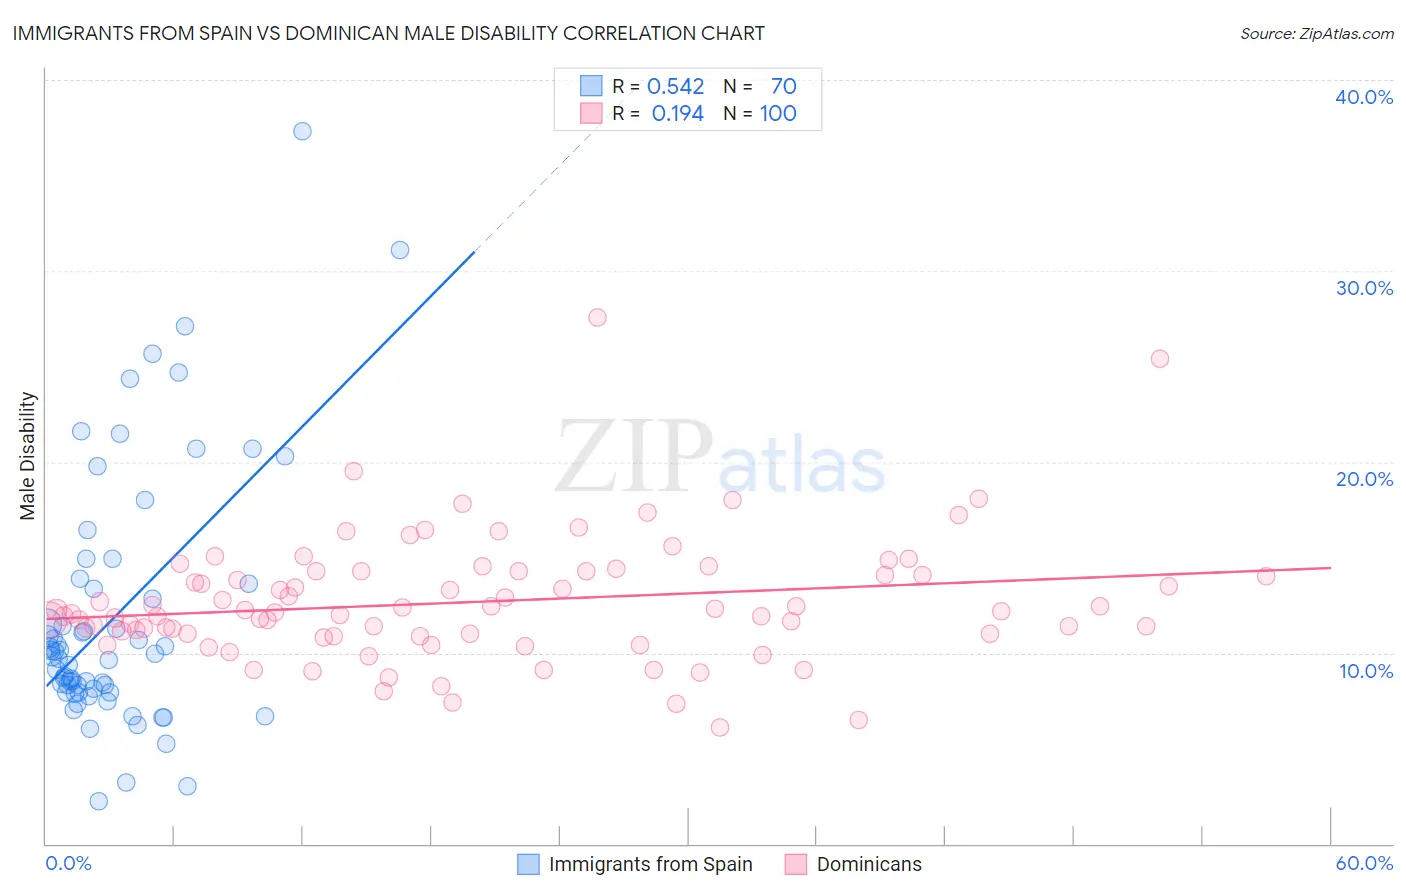
Immigrants from Spain vs Dominican Male Disability Correlation Chart
The statistical analysis conducted on geographies consisting of 239,682,902 people shows a substantial positive correlation between the proportion of Immigrants from Spain and percentage of males with a disability in the United States with a correlation coefficient (R) of 0.542 and weighted average of 10.3%. Similarly, the statistical analysis conducted on geographies consisting of 355,013,685 people shows a poor positive correlation between the proportion of Dominicans and percentage of males with a disability in the United States with a correlation coefficient (R) of 0.194 and weighted average of 11.8%, a difference of 14.6%.
Male Disability Correlation Summary
| Measurement | Immigrants from Spain | Dominican |
| Minimum | 2.2% | 6.1% |
| Maximum | 37.3% | 27.5% |
| Range | 35.1% | 21.4% |
| Mean | 11.9% | 12.7% |
| Median | 9.9% | 12.1% |
| Interquartile 25% (IQ1) | 7.9% | 11.0% |
| Interquartile 75% (IQ3) | 13.6% | 14.3% |
| Interquartile Range (IQR) | 5.7% | 3.3% |
| Standard Deviation (Sample) | 6.7% | 3.3% |
| Standard Deviation (Population) | 6.7% | 3.3% |
Similar Demographics by Male Disability
Demographics Similar to Immigrants from Spain by Male Disability
In terms of male disability, the demographic groups most similar to Immigrants from Spain are Israeli (10.3%, a difference of 0.060%), Immigrants from Peru (10.3%, a difference of 0.090%), Cambodian (10.3%, a difference of 0.13%), South American (10.3%, a difference of 0.13%), and Immigrants from El Salvador (10.3%, a difference of 0.21%).
| Demographics | Rating | Rank | Male Disability |
| Mongolians | 99.7 /100 | #42 | Exceptional 10.3% |
| Immigrants | Bangladesh | 99.7 /100 | #43 | Exceptional 10.3% |
| Immigrants | El Salvador | 99.7 /100 | #44 | Exceptional 10.3% |
| Turks | 99.7 /100 | #45 | Exceptional 10.3% |
| Cambodians | 99.7 /100 | #46 | Exceptional 10.3% |
| Immigrants | Peru | 99.7 /100 | #47 | Exceptional 10.3% |
| Israelis | 99.7 /100 | #48 | Exceptional 10.3% |
| Immigrants | Spain | 99.7 /100 | #49 | Exceptional 10.3% |
| South Americans | 99.6 /100 | #50 | Exceptional 10.3% |
| Salvadorans | 99.6 /100 | #51 | Exceptional 10.4% |
| Immigrants | Saudi Arabia | 99.6 /100 | #52 | Exceptional 10.4% |
| Immigrants | Uzbekistan | 99.6 /100 | #53 | Exceptional 10.4% |
| Peruvians | 99.6 /100 | #54 | Exceptional 10.4% |
| Immigrants | Eritrea | 99.6 /100 | #55 | Exceptional 10.4% |
| Tongans | 99.6 /100 | #56 | Exceptional 10.4% |
Demographics Similar to Dominicans by Male Disability
In terms of male disability, the demographic groups most similar to Dominicans are Malaysian (11.8%, a difference of 0.060%), Mexican (11.8%, a difference of 0.10%), Immigrants from Canada (11.9%, a difference of 0.18%), Croatian (11.8%, a difference of 0.20%), and Bermudan (11.8%, a difference of 0.28%).
| Demographics | Rating | Rank | Male Disability |
| Japanese | 3.1 /100 | #224 | Tragic 11.7% |
| Liberians | 3.1 /100 | #225 | Tragic 11.8% |
| Sub-Saharan Africans | 2.8 /100 | #226 | Tragic 11.8% |
| Austrians | 2.5 /100 | #227 | Tragic 11.8% |
| Hispanics or Latinos | 2.3 /100 | #228 | Tragic 11.8% |
| Bermudans | 2.3 /100 | #229 | Tragic 11.8% |
| Croatians | 2.1 /100 | #230 | Tragic 11.8% |
| Dominicans | 1.8 /100 | #231 | Tragic 11.8% |
| Malaysians | 1.8 /100 | #232 | Tragic 11.8% |
| Mexicans | 1.7 /100 | #233 | Tragic 11.8% |
| Immigrants | Canada | 1.6 /100 | #234 | Tragic 11.9% |
| Immigrants | North America | 1.5 /100 | #235 | Tragic 11.9% |
| U.S. Virgin Islanders | 1.3 /100 | #236 | Tragic 11.9% |
| Carpatho Rusyns | 1.3 /100 | #237 | Tragic 11.9% |
| Yugoslavians | 1.2 /100 | #238 | Tragic 11.9% |