German Russian vs Dutch Disability
COMPARE
German Russian
Dutch
Disability
Disability Comparison
German Russians
Dutch
12.3%
DISABILITY
0.8/ 100
METRIC RATING
254th/ 347
METRIC RANK
12.8%
DISABILITY
0.0/ 100
METRIC RATING
277th/ 347
METRIC RANK
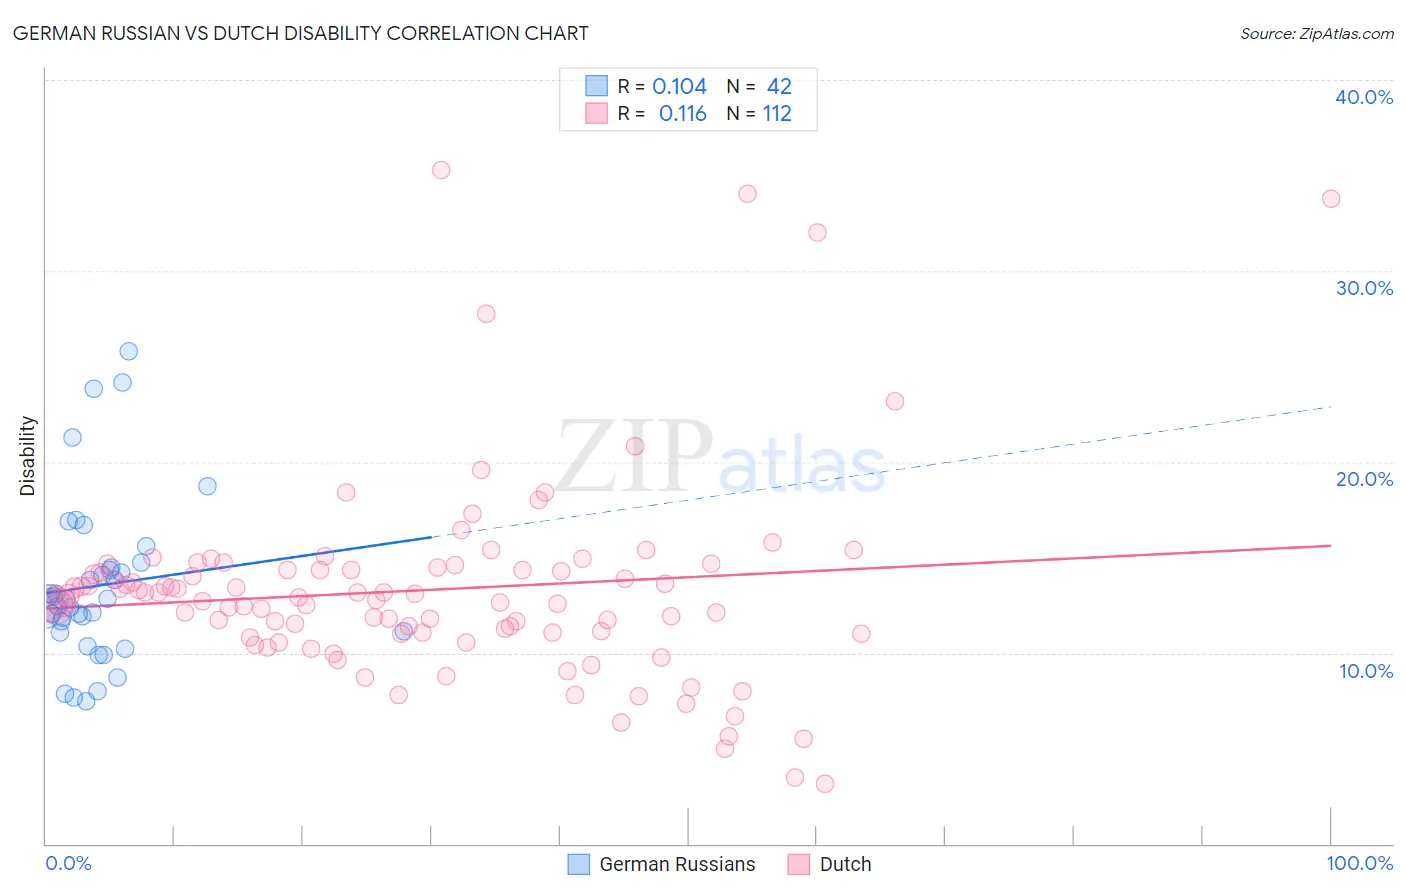
German Russian vs Dutch Disability Correlation Chart
The statistical analysis conducted on geographies consisting of 96,458,633 people shows a poor positive correlation between the proportion of German Russians and percentage of population with a disability in the United States with a correlation coefficient (R) of 0.104 and weighted average of 12.3%. Similarly, the statistical analysis conducted on geographies consisting of 554,259,467 people shows a poor positive correlation between the proportion of Dutch and percentage of population with a disability in the United States with a correlation coefficient (R) of 0.116 and weighted average of 12.8%, a difference of 3.9%.
Disability Correlation Summary
| Measurement | German Russian | Dutch |
| Minimum | 7.4% | 3.1% |
| Maximum | 25.8% | 35.3% |
| Range | 18.4% | 32.1% |
| Mean | 13.5% | 13.3% |
| Median | 12.8% | 12.8% |
| Interquartile 25% (IQ1) | 11.1% | 11.0% |
| Interquartile 75% (IQ3) | 14.5% | 14.4% |
| Interquartile Range (IQR) | 3.4% | 3.3% |
| Standard Deviation (Sample) | 4.2% | 5.3% |
| Standard Deviation (Population) | 4.2% | 5.3% |
Similar Demographics by Disability
Demographics Similar to German Russians by Disability
In terms of disability, the demographic groups most similar to German Russians are Belgian (12.3%, a difference of 0.030%), Bermudan (12.3%, a difference of 0.33%), Slovene (12.4%, a difference of 0.33%), Immigrants from Dominica (12.4%, a difference of 0.39%), and Immigrants from Laos (12.4%, a difference of 0.49%).
| Demographics | Rating | Rank | Disability |
| Indonesians | 1.4 /100 | #247 | Tragic 12.2% |
| Guamanians/Chamorros | 1.4 /100 | #248 | Tragic 12.3% |
| Carpatho Rusyns | 1.4 /100 | #249 | Tragic 12.3% |
| Sub-Saharan Africans | 1.4 /100 | #250 | Tragic 12.3% |
| Europeans | 1.4 /100 | #251 | Tragic 12.3% |
| Bermudans | 1.1 /100 | #252 | Tragic 12.3% |
| Belgians | 0.8 /100 | #253 | Tragic 12.3% |
| German Russians | 0.8 /100 | #254 | Tragic 12.3% |
| Slovenes | 0.6 /100 | #255 | Tragic 12.4% |
| Immigrants | Dominica | 0.6 /100 | #256 | Tragic 12.4% |
| Immigrants | Laos | 0.5 /100 | #257 | Tragic 12.4% |
| Slavs | 0.5 /100 | #258 | Tragic 12.4% |
| Canadians | 0.4 /100 | #259 | Tragic 12.4% |
| Immigrants | Liberia | 0.4 /100 | #260 | Tragic 12.4% |
| Scandinavians | 0.4 /100 | #261 | Tragic 12.4% |
Demographics Similar to Dutch by Disability
In terms of disability, the demographic groups most similar to Dutch are Hmong (12.8%, a difference of 0.050%), German (12.8%, a difference of 0.17%), Sioux (12.8%, a difference of 0.20%), Fijian (12.8%, a difference of 0.26%), and Nepalese (12.8%, a difference of 0.28%).
| Demographics | Rating | Rank | Disability |
| Portuguese | 0.1 /100 | #270 | Tragic 12.6% |
| Immigrants | Yemen | 0.1 /100 | #271 | Tragic 12.6% |
| Dominicans | 0.0 /100 | #272 | Tragic 12.7% |
| Finns | 0.0 /100 | #273 | Tragic 12.7% |
| Nepalese | 0.0 /100 | #274 | Tragic 12.8% |
| Sioux | 0.0 /100 | #275 | Tragic 12.8% |
| Hmong | 0.0 /100 | #276 | Tragic 12.8% |
| Dutch | 0.0 /100 | #277 | Tragic 12.8% |
| Germans | 0.0 /100 | #278 | Tragic 12.8% |
| Fijians | 0.0 /100 | #279 | Tragic 12.8% |
| Spanish | 0.0 /100 | #280 | Tragic 12.8% |
| Immigrants | Portugal | 0.0 /100 | #281 | Tragic 12.9% |
| Scottish | 0.0 /100 | #282 | Tragic 12.9% |
| Irish | 0.0 /100 | #283 | Tragic 12.9% |
| Welsh | 0.0 /100 | #284 | Tragic 12.9% |