Immigrants from South Eastern Asia vs Dutch 1st Grade
COMPARE
Immigrants from South Eastern Asia
Dutch
1st Grade
1st Grade Comparison
Immigrants from South Eastern Asia
Dutch
97.1%
1ST GRADE
0.0/ 100
METRIC RATING
301st/ 347
METRIC RANK
98.6%
1ST GRADE
100.0/ 100
METRIC RATING
18th/ 347
METRIC RANK
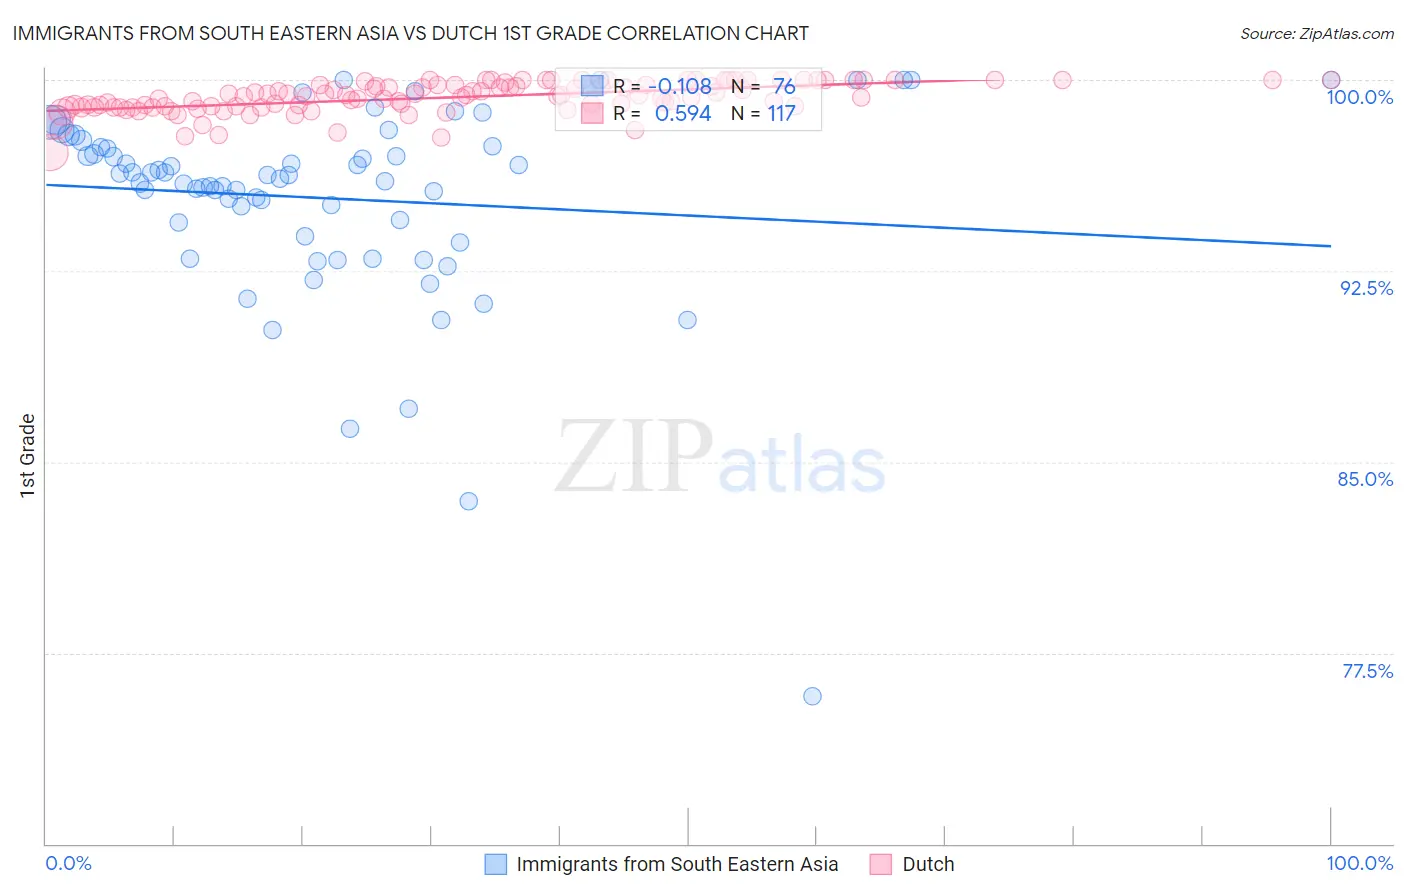
Immigrants from South Eastern Asia vs Dutch 1st Grade Correlation Chart
The statistical analysis conducted on geographies consisting of 512,710,277 people shows a poor negative correlation between the proportion of Immigrants from South Eastern Asia and percentage of population with at least 1st grade education in the United States with a correlation coefficient (R) of -0.108 and weighted average of 97.1%. Similarly, the statistical analysis conducted on geographies consisting of 554,359,260 people shows a substantial positive correlation between the proportion of Dutch and percentage of population with at least 1st grade education in the United States with a correlation coefficient (R) of 0.594 and weighted average of 98.6%, a difference of 1.6%.
1st Grade Correlation Summary
| Measurement | Immigrants from South Eastern Asia | Dutch |
| Minimum | 75.8% | 97.2% |
| Maximum | 100.0% | 100.0% |
| Range | 24.2% | 2.8% |
| Mean | 95.4% | 99.3% |
| Median | 96.2% | 99.4% |
| Interquartile 25% (IQ1) | 94.2% | 98.9% |
| Interquartile 75% (IQ3) | 97.4% | 99.8% |
| Interquartile Range (IQR) | 3.2% | 0.88% |
| Standard Deviation (Sample) | 3.9% | 0.59% |
| Standard Deviation (Population) | 3.9% | 0.59% |
Similar Demographics by 1st Grade
Demographics Similar to Immigrants from South Eastern Asia by 1st Grade
In terms of 1st grade, the demographic groups most similar to Immigrants from South Eastern Asia are Immigrants from Caribbean (97.0%, a difference of 0.020%), Haitian (97.1%, a difference of 0.030%), Immigrants from Dominica (97.1%, a difference of 0.040%), Immigrants from Cuba (97.1%, a difference of 0.040%), and Somali (97.0%, a difference of 0.050%).
| Demographics | Rating | Rank | 1st Grade |
| Immigrants | Grenada | 0.0 /100 | #294 | Tragic 97.2% |
| Immigrants | Immigrants | 0.0 /100 | #295 | Tragic 97.2% |
| Immigrants | Eritrea | 0.0 /100 | #296 | Tragic 97.2% |
| Central American Indians | 0.0 /100 | #297 | Tragic 97.1% |
| Immigrants | Dominica | 0.0 /100 | #298 | Tragic 97.1% |
| Immigrants | Cuba | 0.0 /100 | #299 | Tragic 97.1% |
| Haitians | 0.0 /100 | #300 | Tragic 97.1% |
| Immigrants | South Eastern Asia | 0.0 /100 | #301 | Tragic 97.1% |
| Immigrants | Caribbean | 0.0 /100 | #302 | Tragic 97.0% |
| Somalis | 0.0 /100 | #303 | Tragic 97.0% |
| Nicaraguans | 0.0 /100 | #304 | Tragic 97.0% |
| Ecuadorians | 0.0 /100 | #305 | Tragic 97.0% |
| Belizeans | 0.0 /100 | #306 | Tragic 96.9% |
| Immigrants | Somalia | 0.0 /100 | #307 | Tragic 96.9% |
| Hispanics or Latinos | 0.0 /100 | #308 | Tragic 96.9% |
Demographics Similar to Dutch by 1st Grade
In terms of 1st grade, the demographic groups most similar to Dutch are Aleut (98.6%, a difference of 0.010%), Scottish (98.6%, a difference of 0.010%), Swedish (98.6%, a difference of 0.020%), Irish (98.6%, a difference of 0.020%), and Sioux (98.6%, a difference of 0.030%).
| Demographics | Rating | Rank | 1st Grade |
| Tlingit-Haida | 100.0 /100 | #11 | Exceptional 98.7% |
| Slovenes | 100.0 /100 | #12 | Exceptional 98.7% |
| Carpatho Rusyns | 100.0 /100 | #13 | Exceptional 98.6% |
| English | 100.0 /100 | #14 | Exceptional 98.6% |
| Swedes | 100.0 /100 | #15 | Exceptional 98.6% |
| Aleuts | 100.0 /100 | #16 | Exceptional 98.6% |
| Scottish | 100.0 /100 | #17 | Exceptional 98.6% |
| Dutch | 100.0 /100 | #18 | Exceptional 98.6% |
| Irish | 100.0 /100 | #19 | Exceptional 98.6% |
| Sioux | 100.0 /100 | #20 | Exceptional 98.6% |
| Arapaho | 100.0 /100 | #21 | Exceptional 98.6% |
| Pennsylvania Germans | 100.0 /100 | #22 | Exceptional 98.6% |
| Finns | 100.0 /100 | #23 | Exceptional 98.6% |
| Lithuanians | 100.0 /100 | #24 | Exceptional 98.6% |
| Danes | 100.0 /100 | #25 | Exceptional 98.6% |