Immigrants from South Africa vs Arab Disability Age 5 to 17
COMPARE
Immigrants from South Africa
Arab
Disability Age 5 to 17
Disability Age 5 to 17 Comparison
Immigrants from South Africa
Arabs
5.3%
DISABILITY AGE 5 TO 17
98.1/ 100
METRIC RATING
108th/ 347
METRIC RANK
5.4%
DISABILITY AGE 5 TO 17
92.9/ 100
METRIC RATING
131st/ 347
METRIC RANK
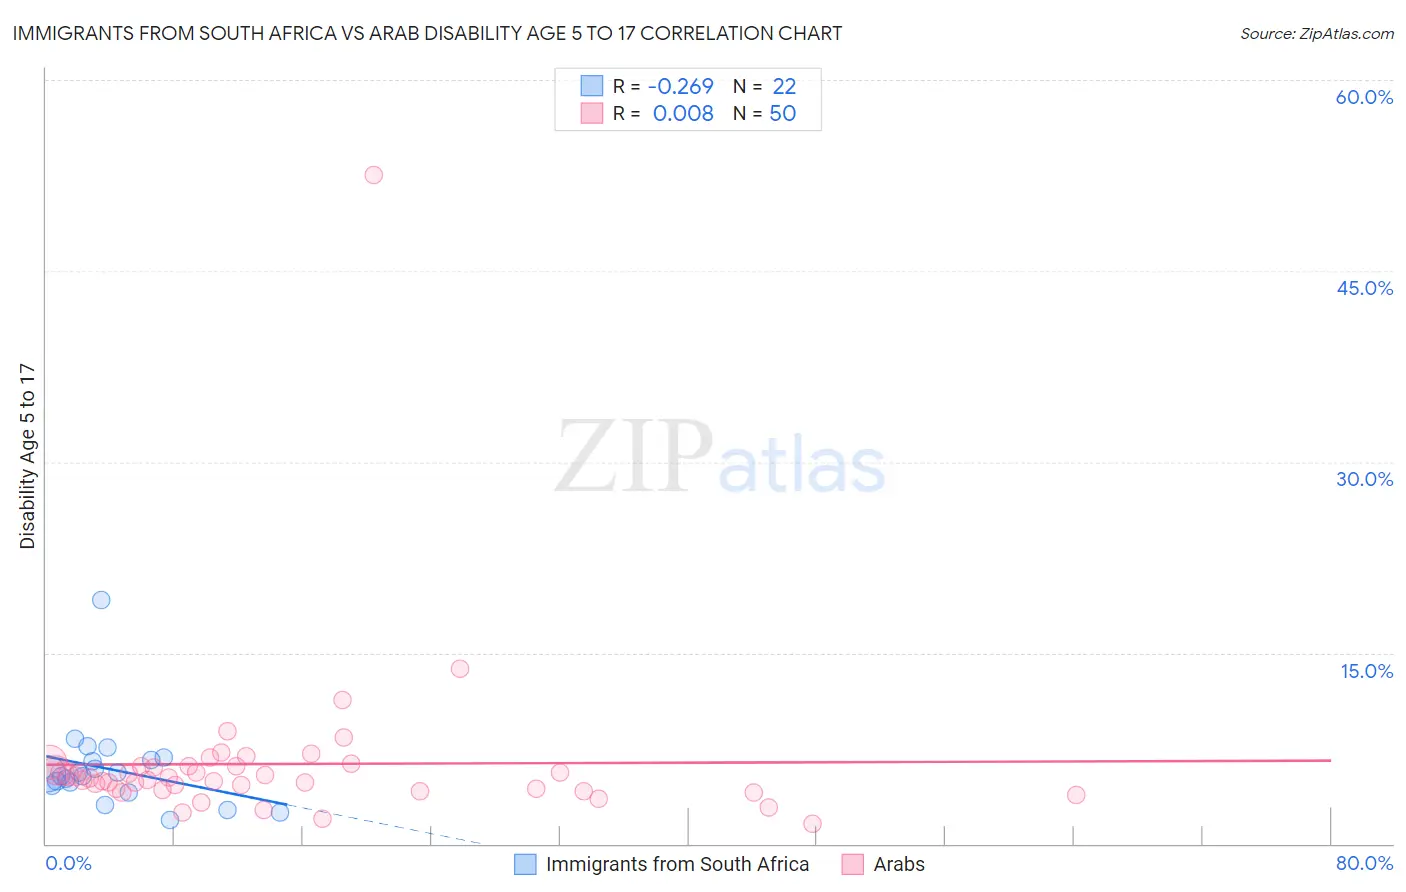
Immigrants from South Africa vs Arab Disability Age 5 to 17 Correlation Chart
The statistical analysis conducted on geographies consisting of 231,812,836 people shows a weak negative correlation between the proportion of Immigrants from South Africa and percentage of population with a disability between the ages 5 and 17 in the United States with a correlation coefficient (R) of -0.269 and weighted average of 5.3%. Similarly, the statistical analysis conducted on geographies consisting of 481,041,182 people shows no correlation between the proportion of Arabs and percentage of population with a disability between the ages 5 and 17 in the United States with a correlation coefficient (R) of 0.008 and weighted average of 5.4%, a difference of 1.8%.
Disability Age 5 to 17 Correlation Summary
| Measurement | Immigrants from South Africa | Arab |
| Minimum | 1.9% | 1.6% |
| Maximum | 19.1% | 52.5% |
| Range | 17.3% | 50.9% |
| Mean | 5.9% | 6.3% |
| Median | 5.4% | 5.1% |
| Interquartile 25% (IQ1) | 4.6% | 4.2% |
| Interquartile 75% (IQ3) | 6.5% | 6.1% |
| Interquartile Range (IQR) | 1.9% | 1.9% |
| Standard Deviation (Sample) | 3.4% | 7.0% |
| Standard Deviation (Population) | 3.3% | 6.9% |
Similar Demographics by Disability Age 5 to 17
Demographics Similar to Immigrants from South Africa by Disability Age 5 to 17
In terms of disability age 5 to 17, the demographic groups most similar to Immigrants from South Africa are Russian (5.3%, a difference of 0.040%), Immigrants from Northern Africa (5.3%, a difference of 0.040%), Immigrants from Yemen (5.3%, a difference of 0.070%), Immigrants from Eritrea (5.3%, a difference of 0.080%), and Ethiopian (5.3%, a difference of 0.12%).
| Demographics | Rating | Rank | Disability Age 5 to 17 |
| Menominee | 98.7 /100 | #101 | Exceptional 5.3% |
| Nicaraguans | 98.6 /100 | #102 | Exceptional 5.3% |
| Salvadorans | 98.6 /100 | #103 | Exceptional 5.3% |
| Peruvians | 98.5 /100 | #104 | Exceptional 5.3% |
| Immigrants | Italy | 98.4 /100 | #105 | Exceptional 5.3% |
| Immigrants | Yemen | 98.2 /100 | #106 | Exceptional 5.3% |
| Russians | 98.2 /100 | #107 | Exceptional 5.3% |
| Immigrants | South Africa | 98.1 /100 | #108 | Exceptional 5.3% |
| Immigrants | Northern Africa | 98.1 /100 | #109 | Exceptional 5.3% |
| Immigrants | Eritrea | 98.0 /100 | #110 | Exceptional 5.3% |
| Ethiopians | 97.9 /100 | #111 | Exceptional 5.3% |
| Immigrants | Latvia | 97.9 /100 | #112 | Exceptional 5.3% |
| Aleuts | 97.8 /100 | #113 | Exceptional 5.3% |
| Immigrants | Northern Europe | 97.8 /100 | #114 | Exceptional 5.3% |
| Cubans | 97.8 /100 | #115 | Exceptional 5.3% |
Demographics Similar to Arabs by Disability Age 5 to 17
In terms of disability age 5 to 17, the demographic groups most similar to Arabs are Immigrants from Colombia (5.4%, a difference of 0.020%), Venezuelan (5.4%, a difference of 0.050%), Yuman (5.4%, a difference of 0.13%), Immigrants from Belize (5.4%, a difference of 0.22%), and Immigrants from Bulgaria (5.4%, a difference of 0.23%).
| Demographics | Rating | Rank | Disability Age 5 to 17 |
| Crow | 95.0 /100 | #124 | Exceptional 5.4% |
| Immigrants | Chile | 95.0 /100 | #125 | Exceptional 5.4% |
| New Zealanders | 95.0 /100 | #126 | Exceptional 5.4% |
| Latvians | 95.0 /100 | #127 | Exceptional 5.4% |
| Immigrants | Venezuela | 94.5 /100 | #128 | Exceptional 5.4% |
| Romanians | 94.1 /100 | #129 | Exceptional 5.4% |
| Immigrants | Bulgaria | 94.0 /100 | #130 | Exceptional 5.4% |
| Arabs | 92.9 /100 | #131 | Exceptional 5.4% |
| Immigrants | Colombia | 92.9 /100 | #132 | Exceptional 5.4% |
| Venezuelans | 92.7 /100 | #133 | Exceptional 5.4% |
| Yuman | 92.3 /100 | #134 | Exceptional 5.4% |
| Immigrants | Belize | 91.7 /100 | #135 | Exceptional 5.4% |
| Immigrants | Denmark | 91.4 /100 | #136 | Exceptional 5.4% |
| Navajo | 90.9 /100 | #137 | Exceptional 5.4% |
| Immigrants | Oceania | 90.8 /100 | #138 | Exceptional 5.4% |