Immigrants from Somalia vs Italian Disability Age Under 5
COMPARE
Immigrants from Somalia
Italian
Disability Age Under 5
Disability Age Under 5 Comparison
Immigrants from Somalia
Italians
1.3%
DISABILITY AGE UNDER 5
31.3/ 100
METRIC RATING
197th/ 347
METRIC RANK
1.6%
DISABILITY AGE UNDER 5
0.0/ 100
METRIC RATING
292nd/ 347
METRIC RANK
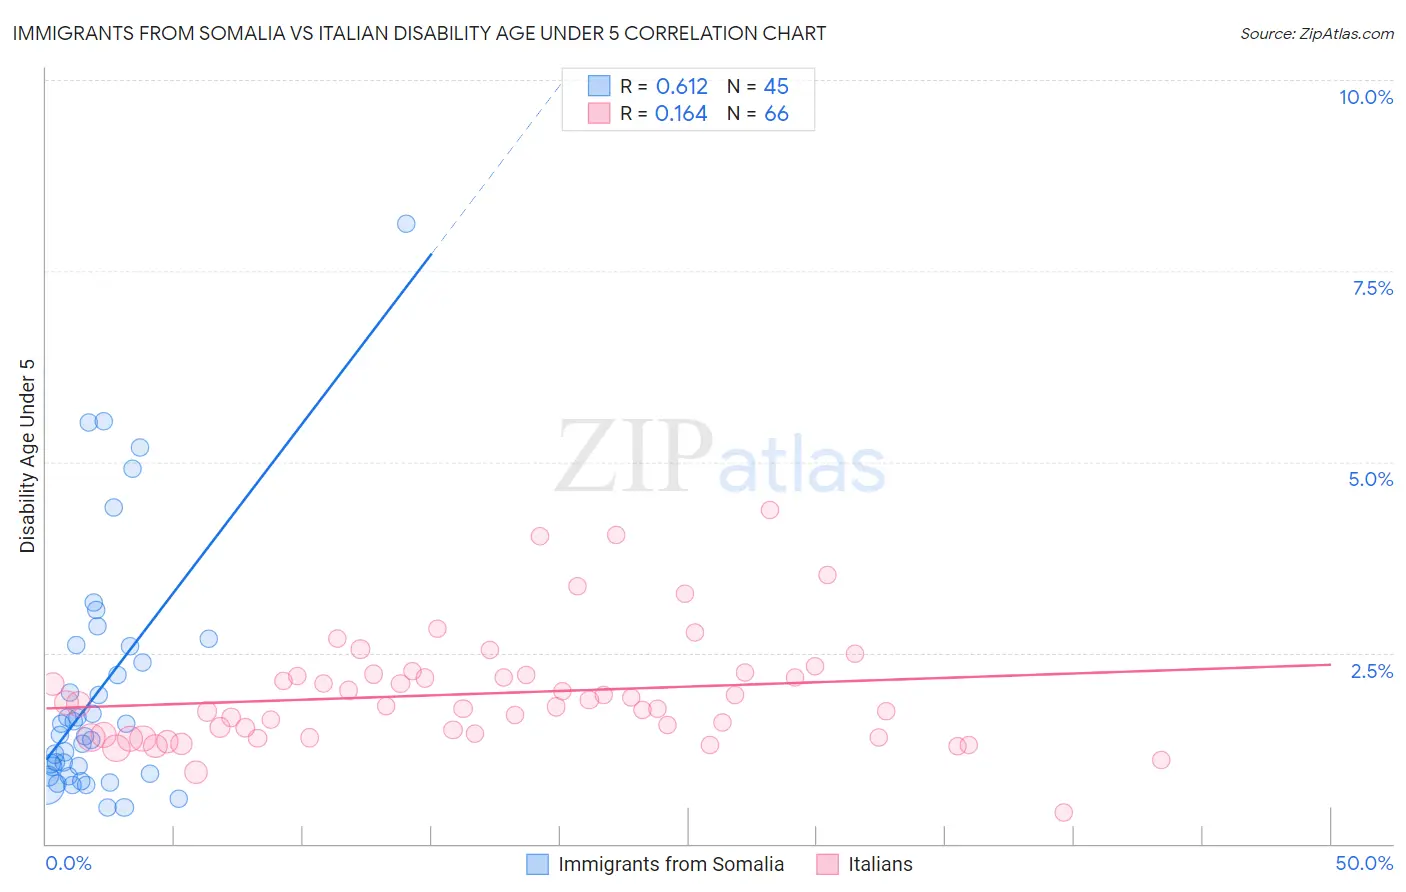
Immigrants from Somalia vs Italian Disability Age Under 5 Correlation Chart
The statistical analysis conducted on geographies consisting of 75,075,754 people shows a significant positive correlation between the proportion of Immigrants from Somalia and percentage of population with a disability under the age of 5 in the United States with a correlation coefficient (R) of 0.612 and weighted average of 1.3%. Similarly, the statistical analysis conducted on geographies consisting of 261,419,311 people shows a poor positive correlation between the proportion of Italians and percentage of population with a disability under the age of 5 in the United States with a correlation coefficient (R) of 0.164 and weighted average of 1.6%, a difference of 23.1%.
Disability Age Under 5 Correlation Summary
| Measurement | Immigrants from Somalia | Italian |
| Minimum | 0.47% | 0.41% |
| Maximum | 8.1% | 4.4% |
| Range | 7.7% | 4.0% |
| Mean | 2.0% | 2.0% |
| Median | 1.4% | 1.8% |
| Interquartile 25% (IQ1) | 0.90% | 1.4% |
| Interquartile 75% (IQ3) | 2.6% | 2.2% |
| Interquartile Range (IQR) | 1.7% | 0.78% |
| Standard Deviation (Sample) | 1.6% | 0.74% |
| Standard Deviation (Population) | 1.6% | 0.73% |
Similar Demographics by Disability Age Under 5
Demographics Similar to Immigrants from Somalia by Disability Age Under 5
In terms of disability age under 5, the demographic groups most similar to Immigrants from Somalia are Immigrants from Belgium (1.3%, a difference of 0.010%), Immigrants from Norway (1.3%, a difference of 0.030%), Jamaican (1.3%, a difference of 0.070%), U.S. Virgin Islander (1.3%, a difference of 0.31%), and Immigrants from North Macedonia (1.3%, a difference of 0.34%).
| Demographics | Rating | Rank | Disability Age Under 5 |
| Immigrants | Laos | 36.6 /100 | #190 | Fair 1.3% |
| Mexican American Indians | 36.6 /100 | #191 | Fair 1.3% |
| Immigrants | Bosnia and Herzegovina | 36.5 /100 | #192 | Fair 1.3% |
| Immigrants | Sierra Leone | 36.5 /100 | #193 | Fair 1.3% |
| Immigrants | North Macedonia | 34.7 /100 | #194 | Fair 1.3% |
| U.S. Virgin Islanders | 34.4 /100 | #195 | Fair 1.3% |
| Immigrants | Belgium | 31.4 /100 | #196 | Fair 1.3% |
| Immigrants | Somalia | 31.3 /100 | #197 | Fair 1.3% |
| Immigrants | Norway | 31.1 /100 | #198 | Fair 1.3% |
| Jamaicans | 30.7 /100 | #199 | Fair 1.3% |
| Immigrants | Lithuania | 27.2 /100 | #200 | Fair 1.3% |
| Immigrants | Italy | 25.4 /100 | #201 | Fair 1.3% |
| Arapaho | 24.1 /100 | #202 | Fair 1.3% |
| Liberians | 24.0 /100 | #203 | Fair 1.3% |
| Immigrants | Europe | 23.6 /100 | #204 | Fair 1.3% |
Demographics Similar to Italians by Disability Age Under 5
In terms of disability age under 5, the demographic groups most similar to Italians are Northern European (1.6%, a difference of 0.14%), Czech (1.5%, a difference of 0.24%), Hungarian (1.5%, a difference of 0.37%), Lithuanian (1.6%, a difference of 0.46%), and Estonian (1.5%, a difference of 0.50%).
| Demographics | Rating | Rank | Disability Age Under 5 |
| Croatians | 0.0 /100 | #285 | Tragic 1.5% |
| Tlingit-Haida | 0.0 /100 | #286 | Tragic 1.5% |
| Scandinavians | 0.0 /100 | #287 | Tragic 1.5% |
| Estonians | 0.0 /100 | #288 | Tragic 1.5% |
| Hungarians | 0.0 /100 | #289 | Tragic 1.5% |
| Czechs | 0.0 /100 | #290 | Tragic 1.5% |
| Northern Europeans | 0.0 /100 | #291 | Tragic 1.6% |
| Italians | 0.0 /100 | #292 | Tragic 1.6% |
| Lithuanians | 0.0 /100 | #293 | Tragic 1.6% |
| Swedes | 0.0 /100 | #294 | Tragic 1.6% |
| Finns | 0.0 /100 | #295 | Tragic 1.6% |
| Poles | 0.0 /100 | #296 | Tragic 1.6% |
| Immigrants | Nonimmigrants | 0.0 /100 | #297 | Tragic 1.6% |
| Cajuns | 0.0 /100 | #298 | Tragic 1.6% |
| Portuguese | 0.0 /100 | #299 | Tragic 1.6% |