Immigrants from Somalia vs Italian Male Poverty
COMPARE
Immigrants from Somalia
Italian
Male Poverty
Male Poverty Comparison
Immigrants from Somalia
Italians
14.6%
MALE POVERTY
0.0/ 100
METRIC RATING
313th/ 347
METRIC RANK
9.6%
MALE POVERTY
99.7/ 100
METRIC RATING
23rd/ 347
METRIC RANK
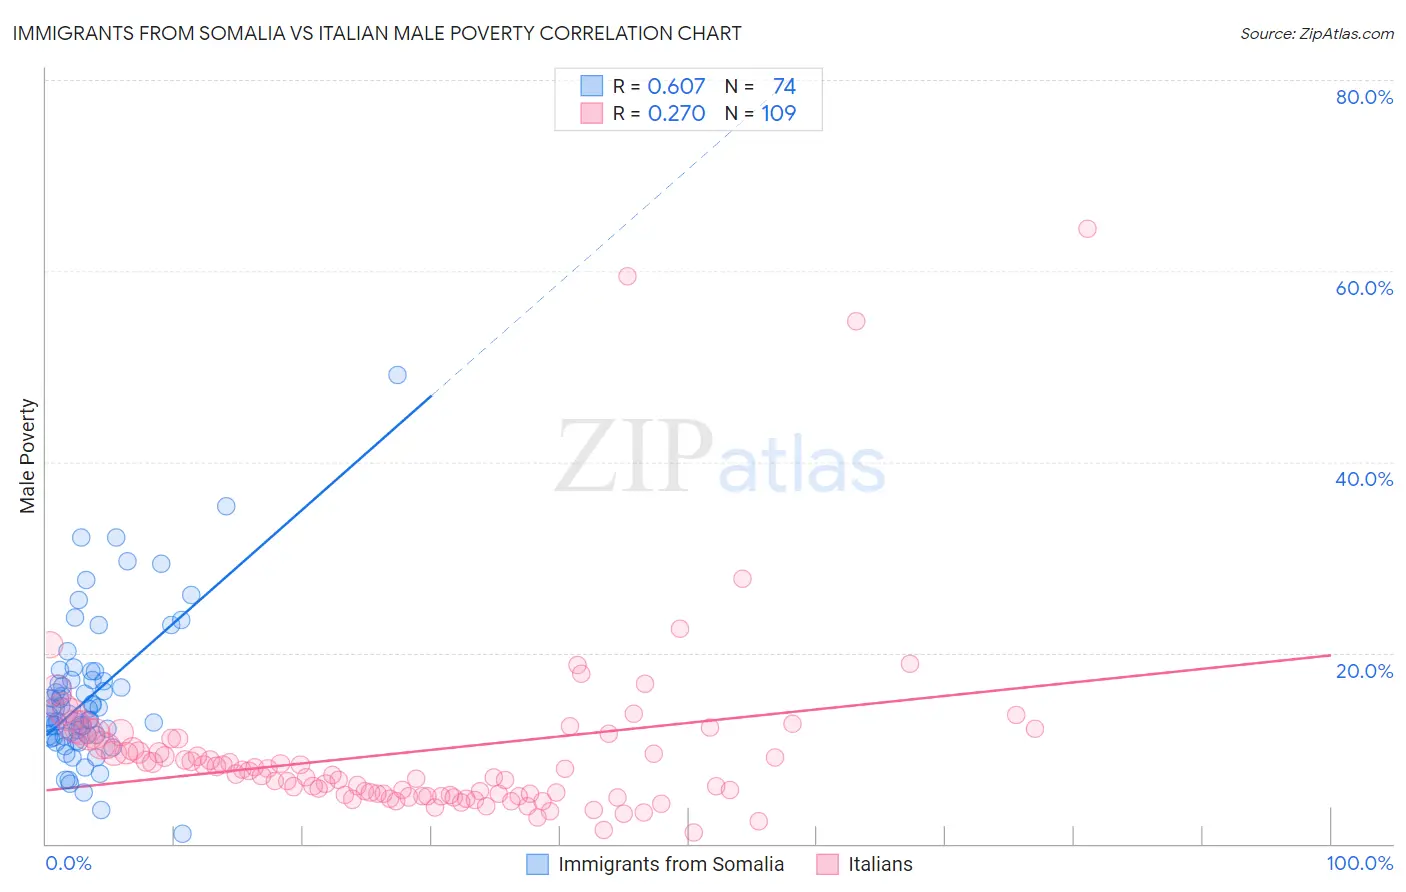
Immigrants from Somalia vs Italian Male Poverty Correlation Chart
The statistical analysis conducted on geographies consisting of 92,092,836 people shows a significant positive correlation between the proportion of Immigrants from Somalia and poverty level among males in the United States with a correlation coefficient (R) of 0.607 and weighted average of 14.6%. Similarly, the statistical analysis conducted on geographies consisting of 573,221,501 people shows a weak positive correlation between the proportion of Italians and poverty level among males in the United States with a correlation coefficient (R) of 0.270 and weighted average of 9.6%, a difference of 51.6%.
Male Poverty Correlation Summary
| Measurement | Immigrants from Somalia | Italian |
| Minimum | 1.0% | 1.2% |
| Maximum | 49.1% | 64.4% |
| Range | 48.1% | 63.1% |
| Mean | 15.5% | 9.6% |
| Median | 13.8% | 7.3% |
| Interquartile 25% (IQ1) | 11.3% | 5.1% |
| Interquartile 75% (IQ3) | 17.2% | 10.7% |
| Interquartile Range (IQR) | 5.9% | 5.6% |
| Standard Deviation (Sample) | 7.8% | 9.6% |
| Standard Deviation (Population) | 7.7% | 9.5% |
Similar Demographics by Male Poverty
Demographics Similar to Immigrants from Somalia by Male Poverty
In terms of male poverty, the demographic groups most similar to Immigrants from Somalia are Immigrants from Honduras (14.6%, a difference of 0.040%), Chippewa (14.6%, a difference of 0.11%), British West Indian (14.6%, a difference of 0.14%), Immigrants from Dominica (14.7%, a difference of 0.82%), and Immigrants from Grenada (14.7%, a difference of 0.87%).
| Demographics | Rating | Rank | Male Poverty |
| Creek | 0.0 /100 | #306 | Tragic 14.1% |
| Dutch West Indians | 0.0 /100 | #307 | Tragic 14.2% |
| Africans | 0.0 /100 | #308 | Tragic 14.2% |
| Somalis | 0.0 /100 | #309 | Tragic 14.3% |
| Seminole | 0.0 /100 | #310 | Tragic 14.3% |
| Hondurans | 0.0 /100 | #311 | Tragic 14.3% |
| Choctaw | 0.0 /100 | #312 | Tragic 14.4% |
| Immigrants | Somalia | 0.0 /100 | #313 | Tragic 14.6% |
| Immigrants | Honduras | 0.0 /100 | #314 | Tragic 14.6% |
| Chippewa | 0.0 /100 | #315 | Tragic 14.6% |
| British West Indians | 0.0 /100 | #316 | Tragic 14.6% |
| Immigrants | Dominica | 0.0 /100 | #317 | Tragic 14.7% |
| Immigrants | Grenada | 0.0 /100 | #318 | Tragic 14.7% |
| U.S. Virgin Islanders | 0.0 /100 | #319 | Tragic 14.7% |
| Immigrants | Congo | 0.0 /100 | #320 | Tragic 14.7% |
Demographics Similar to Italians by Male Poverty
In terms of male poverty, the demographic groups most similar to Italians are Croatian (9.6%, a difference of 0.010%), Swedish (9.6%, a difference of 0.080%), Eastern European (9.6%, a difference of 0.22%), Immigrants from Scotland (9.6%, a difference of 0.26%), and Latvian (9.6%, a difference of 0.52%).
| Demographics | Rating | Rank | Male Poverty |
| Luxembourgers | 99.8 /100 | #16 | Exceptional 9.5% |
| Norwegians | 99.8 /100 | #17 | Exceptional 9.5% |
| Lithuanians | 99.8 /100 | #18 | Exceptional 9.5% |
| Immigrants | Hong Kong | 99.7 /100 | #19 | Exceptional 9.6% |
| Latvians | 99.7 /100 | #20 | Exceptional 9.6% |
| Immigrants | Scotland | 99.7 /100 | #21 | Exceptional 9.6% |
| Croatians | 99.7 /100 | #22 | Exceptional 9.6% |
| Italians | 99.7 /100 | #23 | Exceptional 9.6% |
| Swedes | 99.7 /100 | #24 | Exceptional 9.6% |
| Eastern Europeans | 99.6 /100 | #25 | Exceptional 9.6% |
| Burmese | 99.6 /100 | #26 | Exceptional 9.7% |
| Danes | 99.6 /100 | #27 | Exceptional 9.7% |
| Immigrants | Korea | 99.6 /100 | #28 | Exceptional 9.7% |
| Greeks | 99.6 /100 | #29 | Exceptional 9.7% |
| Poles | 99.5 /100 | #30 | Exceptional 9.7% |