Immigrants from Somalia vs Immigrants from Oceania Disability Age Under 5
COMPARE
Immigrants from Somalia
Immigrants from Oceania
Disability Age Under 5
Disability Age Under 5 Comparison
Immigrants from Somalia
Immigrants from Oceania
1.3%
DISABILITY AGE UNDER 5
31.3/ 100
METRIC RATING
197th/ 347
METRIC RANK
1.2%
DISABILITY AGE UNDER 5
94.2/ 100
METRIC RATING
113th/ 347
METRIC RANK
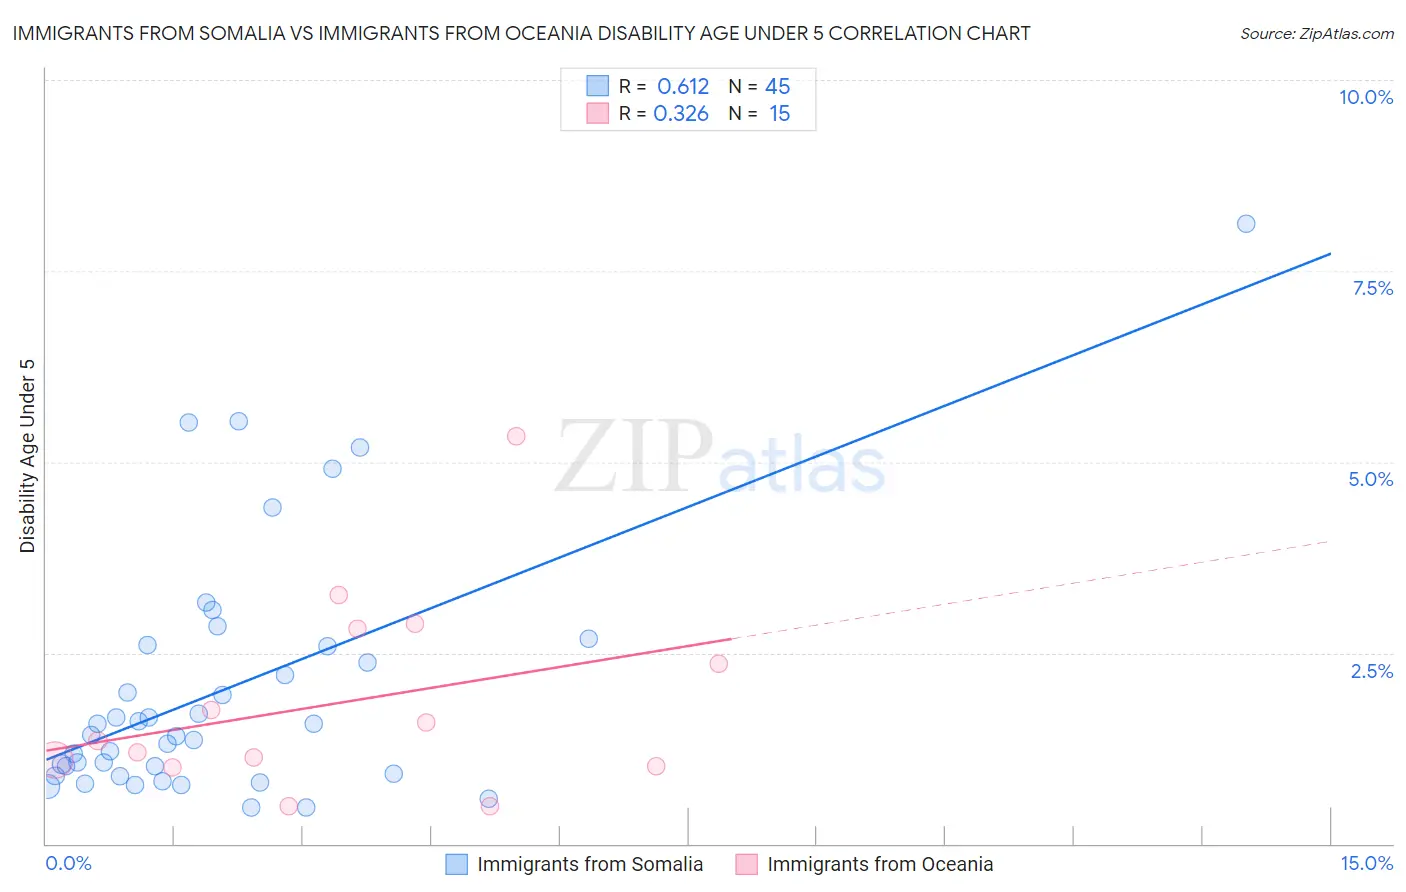
Immigrants from Somalia vs Immigrants from Oceania Disability Age Under 5 Correlation Chart
The statistical analysis conducted on geographies consisting of 75,075,754 people shows a significant positive correlation between the proportion of Immigrants from Somalia and percentage of population with a disability under the age of 5 in the United States with a correlation coefficient (R) of 0.612 and weighted average of 1.3%. Similarly, the statistical analysis conducted on geographies consisting of 180,365,611 people shows a mild positive correlation between the proportion of Immigrants from Oceania and percentage of population with a disability under the age of 5 in the United States with a correlation coefficient (R) of 0.326 and weighted average of 1.2%, a difference of 8.6%.
Disability Age Under 5 Correlation Summary
| Measurement | Immigrants from Somalia | Immigrants from Oceania |
| Minimum | 0.47% | 0.49% |
| Maximum | 8.1% | 5.3% |
| Range | 7.7% | 4.9% |
| Mean | 2.0% | 1.9% |
| Median | 1.4% | 1.3% |
| Interquartile 25% (IQ1) | 0.90% | 1.0% |
| Interquartile 75% (IQ3) | 2.6% | 2.8% |
| Interquartile Range (IQR) | 1.7% | 1.8% |
| Standard Deviation (Sample) | 1.6% | 1.3% |
| Standard Deviation (Population) | 1.6% | 1.2% |
Similar Demographics by Disability Age Under 5
Demographics Similar to Immigrants from Somalia by Disability Age Under 5
In terms of disability age under 5, the demographic groups most similar to Immigrants from Somalia are Immigrants from Belgium (1.3%, a difference of 0.010%), Immigrants from Norway (1.3%, a difference of 0.030%), Jamaican (1.3%, a difference of 0.070%), U.S. Virgin Islander (1.3%, a difference of 0.31%), and Immigrants from North Macedonia (1.3%, a difference of 0.34%).
| Demographics | Rating | Rank | Disability Age Under 5 |
| Immigrants | Laos | 36.6 /100 | #190 | Fair 1.3% |
| Mexican American Indians | 36.6 /100 | #191 | Fair 1.3% |
| Immigrants | Bosnia and Herzegovina | 36.5 /100 | #192 | Fair 1.3% |
| Immigrants | Sierra Leone | 36.5 /100 | #193 | Fair 1.3% |
| Immigrants | North Macedonia | 34.7 /100 | #194 | Fair 1.3% |
| U.S. Virgin Islanders | 34.4 /100 | #195 | Fair 1.3% |
| Immigrants | Belgium | 31.4 /100 | #196 | Fair 1.3% |
| Immigrants | Somalia | 31.3 /100 | #197 | Fair 1.3% |
| Immigrants | Norway | 31.1 /100 | #198 | Fair 1.3% |
| Jamaicans | 30.7 /100 | #199 | Fair 1.3% |
| Immigrants | Lithuania | 27.2 /100 | #200 | Fair 1.3% |
| Immigrants | Italy | 25.4 /100 | #201 | Fair 1.3% |
| Arapaho | 24.1 /100 | #202 | Fair 1.3% |
| Liberians | 24.0 /100 | #203 | Fair 1.3% |
| Immigrants | Europe | 23.6 /100 | #204 | Fair 1.3% |
Demographics Similar to Immigrants from Oceania by Disability Age Under 5
In terms of disability age under 5, the demographic groups most similar to Immigrants from Oceania are Immigrants from Australia (1.2%, a difference of 0.060%), Belizean (1.2%, a difference of 0.15%), Immigrants from Caribbean (1.2%, a difference of 0.16%), Senegalese (1.2%, a difference of 0.17%), and Immigrants from Northern Africa (1.2%, a difference of 0.18%).
| Demographics | Rating | Rank | Disability Age Under 5 |
| Cambodians | 95.4 /100 | #106 | Exceptional 1.2% |
| Immigrants | West Indies | 95.3 /100 | #107 | Exceptional 1.2% |
| Iraqis | 95.1 /100 | #108 | Exceptional 1.2% |
| Immigrants | Panama | 95.0 /100 | #109 | Exceptional 1.2% |
| Immigrants | Lebanon | 95.0 /100 | #110 | Exceptional 1.2% |
| Senegalese | 94.6 /100 | #111 | Exceptional 1.2% |
| Immigrants | Australia | 94.4 /100 | #112 | Exceptional 1.2% |
| Immigrants | Oceania | 94.2 /100 | #113 | Exceptional 1.2% |
| Belizeans | 93.9 /100 | #114 | Exceptional 1.2% |
| Immigrants | Caribbean | 93.8 /100 | #115 | Exceptional 1.2% |
| Immigrants | Northern Africa | 93.8 /100 | #116 | Exceptional 1.2% |
| Immigrants | Philippines | 93.5 /100 | #117 | Exceptional 1.2% |
| Immigrants | Venezuela | 93.4 /100 | #118 | Exceptional 1.2% |
| Bhutanese | 92.5 /100 | #119 | Exceptional 1.2% |
| Immigrants | Eritrea | 92.3 /100 | #120 | Exceptional 1.2% |