Immigrants from Senegal vs Immigrants from Laos Disability Age 5 to 17
COMPARE
Immigrants from Senegal
Immigrants from Laos
Disability Age 5 to 17
Disability Age 5 to 17 Comparison
Immigrants from Senegal
Immigrants from Laos
6.2%
DISABILITY AGE 5 TO 17
0.0/ 100
METRIC RATING
292nd/ 347
METRIC RANK
5.8%
DISABILITY AGE 5 TO 17
3.8/ 100
METRIC RATING
232nd/ 347
METRIC RANK
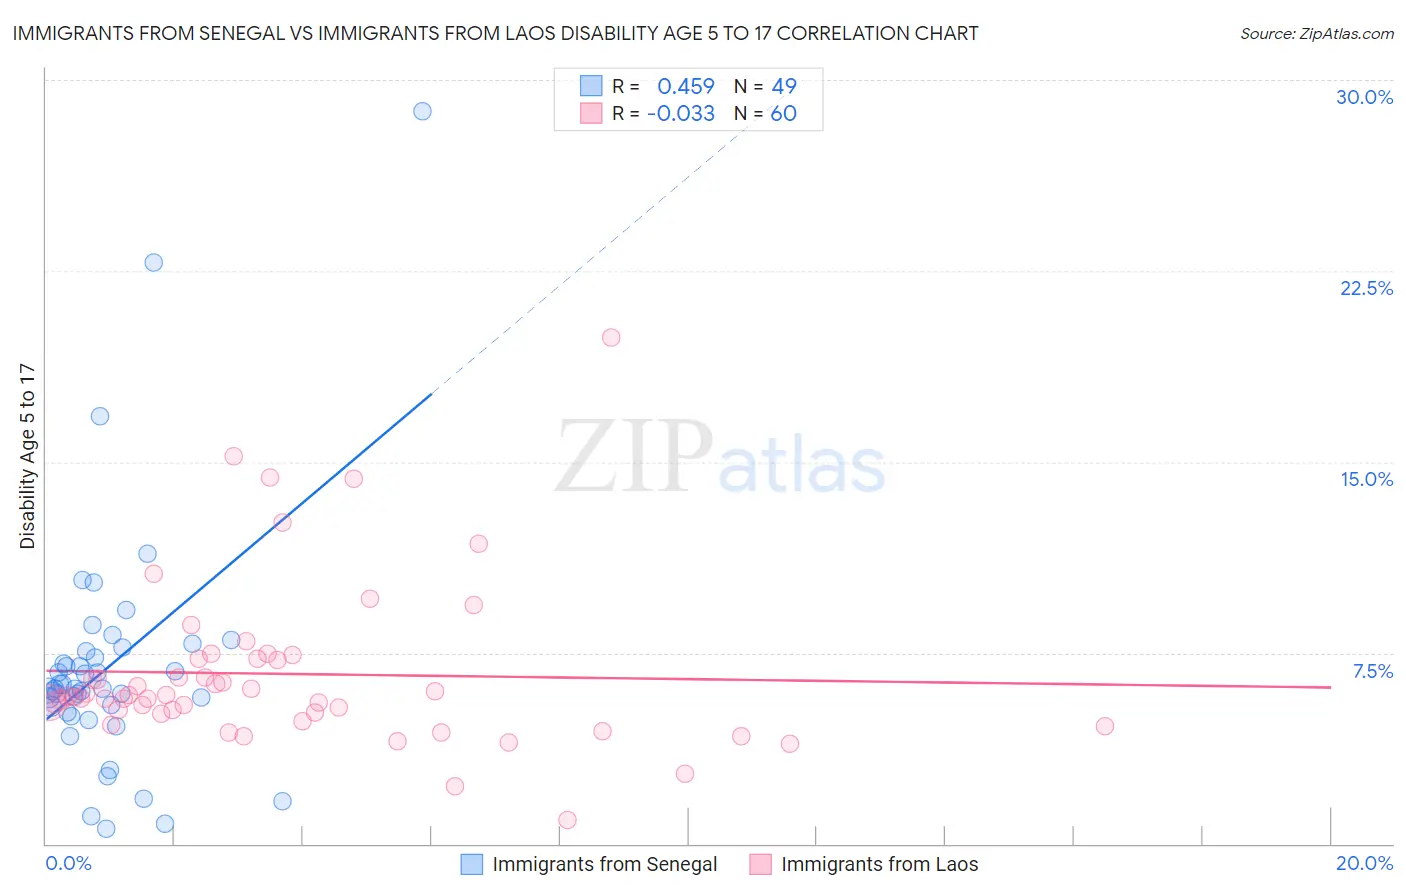
Immigrants from Senegal vs Immigrants from Laos Disability Age 5 to 17 Correlation Chart
The statistical analysis conducted on geographies consisting of 90,044,083 people shows a moderate positive correlation between the proportion of Immigrants from Senegal and percentage of population with a disability between the ages 5 and 17 in the United States with a correlation coefficient (R) of 0.459 and weighted average of 6.2%. Similarly, the statistical analysis conducted on geographies consisting of 200,910,190 people shows no correlation between the proportion of Immigrants from Laos and percentage of population with a disability between the ages 5 and 17 in the United States with a correlation coefficient (R) of -0.033 and weighted average of 5.8%, a difference of 6.7%.
Disability Age 5 to 17 Correlation Summary
| Measurement | Immigrants from Senegal | Immigrants from Laos |
| Minimum | 0.58% | 0.93% |
| Maximum | 28.8% | 19.9% |
| Range | 28.2% | 19.0% |
| Mean | 7.0% | 6.7% |
| Median | 6.1% | 5.8% |
| Interquartile 25% (IQ1) | 5.3% | 5.1% |
| Interquartile 75% (IQ3) | 7.6% | 7.3% |
| Interquartile Range (IQR) | 2.3% | 2.1% |
| Standard Deviation (Sample) | 4.8% | 3.3% |
| Standard Deviation (Population) | 4.8% | 3.2% |
Similar Demographics by Disability Age 5 to 17
Demographics Similar to Immigrants from Senegal by Disability Age 5 to 17
In terms of disability age 5 to 17, the demographic groups most similar to Immigrants from Senegal are Central American Indian (6.2%, a difference of 0.020%), Irish (6.2%, a difference of 0.020%), White/Caucasian (6.2%, a difference of 0.24%), Cree (6.2%, a difference of 0.29%), and Spanish American (6.2%, a difference of 0.32%).
| Demographics | Rating | Rank | Disability Age 5 to 17 |
| English | 0.0 /100 | #285 | Tragic 6.2% |
| Colville | 0.0 /100 | #286 | Tragic 6.2% |
| Pima | 0.0 /100 | #287 | Tragic 6.2% |
| Jamaicans | 0.0 /100 | #288 | Tragic 6.2% |
| Yaqui | 0.0 /100 | #289 | Tragic 6.2% |
| Immigrants | Congo | 0.0 /100 | #290 | Tragic 6.2% |
| Whites/Caucasians | 0.0 /100 | #291 | Tragic 6.2% |
| Immigrants | Senegal | 0.0 /100 | #292 | Tragic 6.2% |
| Central American Indians | 0.0 /100 | #293 | Tragic 6.2% |
| Irish | 0.0 /100 | #294 | Tragic 6.2% |
| Cree | 0.0 /100 | #295 | Tragic 6.2% |
| Spanish Americans | 0.0 /100 | #296 | Tragic 6.2% |
| Immigrants | Bahamas | 0.0 /100 | #297 | Tragic 6.2% |
| Lumbee | 0.0 /100 | #298 | Tragic 6.2% |
| Welsh | 0.0 /100 | #299 | Tragic 6.3% |
Demographics Similar to Immigrants from Laos by Disability Age 5 to 17
In terms of disability age 5 to 17, the demographic groups most similar to Immigrants from Laos are Immigrants from West Indies (5.8%, a difference of 0.090%), Immigrants from Kenya (5.8%, a difference of 0.13%), Malaysian (5.8%, a difference of 0.14%), European (5.8%, a difference of 0.20%), and Immigrants from Brazil (5.8%, a difference of 0.20%).
| Demographics | Rating | Rank | Disability Age 5 to 17 |
| Guamanians/Chamorros | 5.6 /100 | #225 | Tragic 5.8% |
| British West Indians | 5.4 /100 | #226 | Tragic 5.8% |
| Swiss | 5.1 /100 | #227 | Tragic 5.8% |
| Haitians | 4.8 /100 | #228 | Tragic 5.8% |
| Bangladeshis | 4.8 /100 | #229 | Tragic 5.8% |
| Ghanaians | 4.7 /100 | #230 | Tragic 5.8% |
| Europeans | 4.5 /100 | #231 | Tragic 5.8% |
| Immigrants | Laos | 3.8 /100 | #232 | Tragic 5.8% |
| Immigrants | West Indies | 3.5 /100 | #233 | Tragic 5.8% |
| Immigrants | Kenya | 3.4 /100 | #234 | Tragic 5.8% |
| Malaysians | 3.4 /100 | #235 | Tragic 5.8% |
| Immigrants | Brazil | 3.2 /100 | #236 | Tragic 5.8% |
| Sudanese | 2.9 /100 | #237 | Tragic 5.8% |
| Hungarians | 2.6 /100 | #238 | Tragic 5.8% |
| German Russians | 2.4 /100 | #239 | Tragic 5.9% |