Immigrants from Senegal vs Central American Indian Disability Age 5 to 17
COMPARE
Immigrants from Senegal
Central American Indian
Disability Age 5 to 17
Disability Age 5 to 17 Comparison
Immigrants from Senegal
Central American Indians
6.2%
DISABILITY AGE 5 TO 17
0.0/ 100
METRIC RATING
292nd/ 347
METRIC RANK
6.2%
DISABILITY AGE 5 TO 17
0.0/ 100
METRIC RATING
293rd/ 347
METRIC RANK
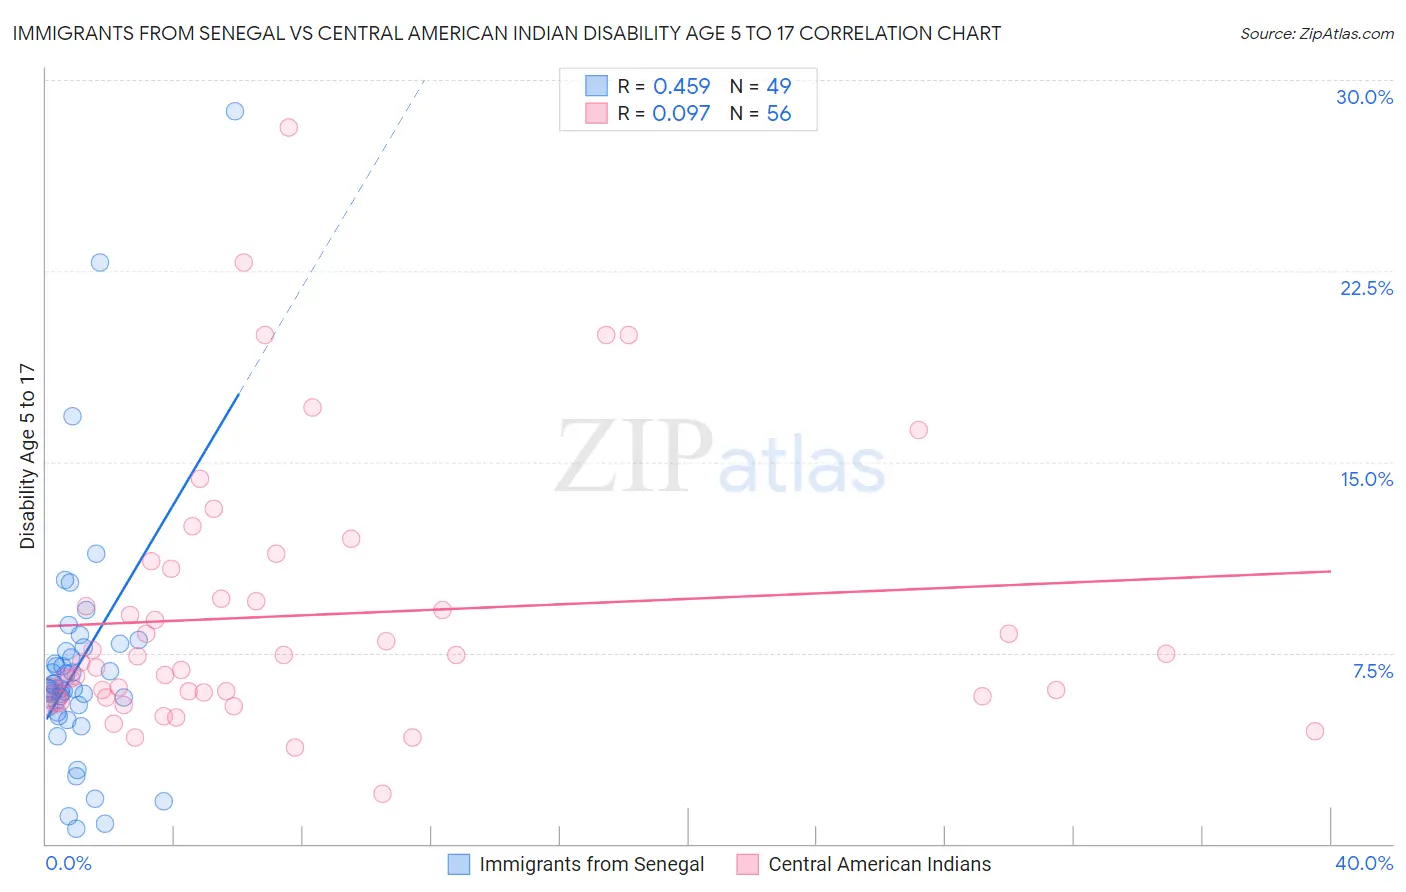
Immigrants from Senegal vs Central American Indian Disability Age 5 to 17 Correlation Chart
The statistical analysis conducted on geographies consisting of 90,044,083 people shows a moderate positive correlation between the proportion of Immigrants from Senegal and percentage of population with a disability between the ages 5 and 17 in the United States with a correlation coefficient (R) of 0.459 and weighted average of 6.2%. Similarly, the statistical analysis conducted on geographies consisting of 324,856,277 people shows a slight positive correlation between the proportion of Central American Indians and percentage of population with a disability between the ages 5 and 17 in the United States with a correlation coefficient (R) of 0.097 and weighted average of 6.2%, a difference of 0.020%.
Disability Age 5 to 17 Correlation Summary
| Measurement | Immigrants from Senegal | Central American Indian |
| Minimum | 0.58% | 2.0% |
| Maximum | 28.8% | 28.1% |
| Range | 28.2% | 26.2% |
| Mean | 7.0% | 9.0% |
| Median | 6.1% | 7.2% |
| Interquartile 25% (IQ1) | 5.3% | 5.8% |
| Interquartile 75% (IQ3) | 7.6% | 10.2% |
| Interquartile Range (IQR) | 2.3% | 4.4% |
| Standard Deviation (Sample) | 4.8% | 5.2% |
| Standard Deviation (Population) | 4.8% | 5.2% |
Demographics Similar to Immigrants from Senegal and Central American Indians by Disability Age 5 to 17
In terms of disability age 5 to 17, the demographic groups most similar to Immigrants from Senegal are Irish (6.2%, a difference of 0.020%), White/Caucasian (6.2%, a difference of 0.24%), Cree (6.2%, a difference of 0.29%), Spanish American (6.2%, a difference of 0.32%), and Yaqui (6.2%, a difference of 0.39%). Similarly, the demographic groups most similar to Central American Indians are Irish (6.2%, a difference of 0.0%), White/Caucasian (6.2%, a difference of 0.26%), Cree (6.2%, a difference of 0.28%), Spanish American (6.2%, a difference of 0.30%), and Immigrants from Congo (6.2%, a difference of 0.40%).
| Demographics | Rating | Rank | Disability Age 5 to 17 |
| Germans | 0.0 /100 | #282 | Tragic 6.1% |
| Ugandans | 0.0 /100 | #283 | Tragic 6.2% |
| Sub-Saharan Africans | 0.0 /100 | #284 | Tragic 6.2% |
| English | 0.0 /100 | #285 | Tragic 6.2% |
| Colville | 0.0 /100 | #286 | Tragic 6.2% |
| Pima | 0.0 /100 | #287 | Tragic 6.2% |
| Jamaicans | 0.0 /100 | #288 | Tragic 6.2% |
| Yaqui | 0.0 /100 | #289 | Tragic 6.2% |
| Immigrants | Congo | 0.0 /100 | #290 | Tragic 6.2% |
| Whites/Caucasians | 0.0 /100 | #291 | Tragic 6.2% |
| Immigrants | Senegal | 0.0 /100 | #292 | Tragic 6.2% |
| Central American Indians | 0.0 /100 | #293 | Tragic 6.2% |
| Irish | 0.0 /100 | #294 | Tragic 6.2% |
| Cree | 0.0 /100 | #295 | Tragic 6.2% |
| Spanish Americans | 0.0 /100 | #296 | Tragic 6.2% |
| Immigrants | Bahamas | 0.0 /100 | #297 | Tragic 6.2% |
| Lumbee | 0.0 /100 | #298 | Tragic 6.2% |
| Welsh | 0.0 /100 | #299 | Tragic 6.3% |
| Carpatho Rusyns | 0.0 /100 | #300 | Tragic 6.3% |
| U.S. Virgin Islanders | 0.0 /100 | #301 | Tragic 6.3% |
| Celtics | 0.0 /100 | #302 | Tragic 6.3% |