Immigrants from Senegal vs Immigrants from Laos In Labor Force | Age 45-54
COMPARE
Immigrants from Senegal
Immigrants from Laos
In Labor Force | Age 45-54
In Labor Force | Age 45-54 Comparison
Immigrants from Senegal
Immigrants from Laos
82.0%
IN LABOR FORCE | AGE 45-54
1.7/ 100
METRIC RATING
231st/ 347
METRIC RANK
81.6%
IN LABOR FORCE | AGE 45-54
0.2/ 100
METRIC RATING
254th/ 347
METRIC RANK
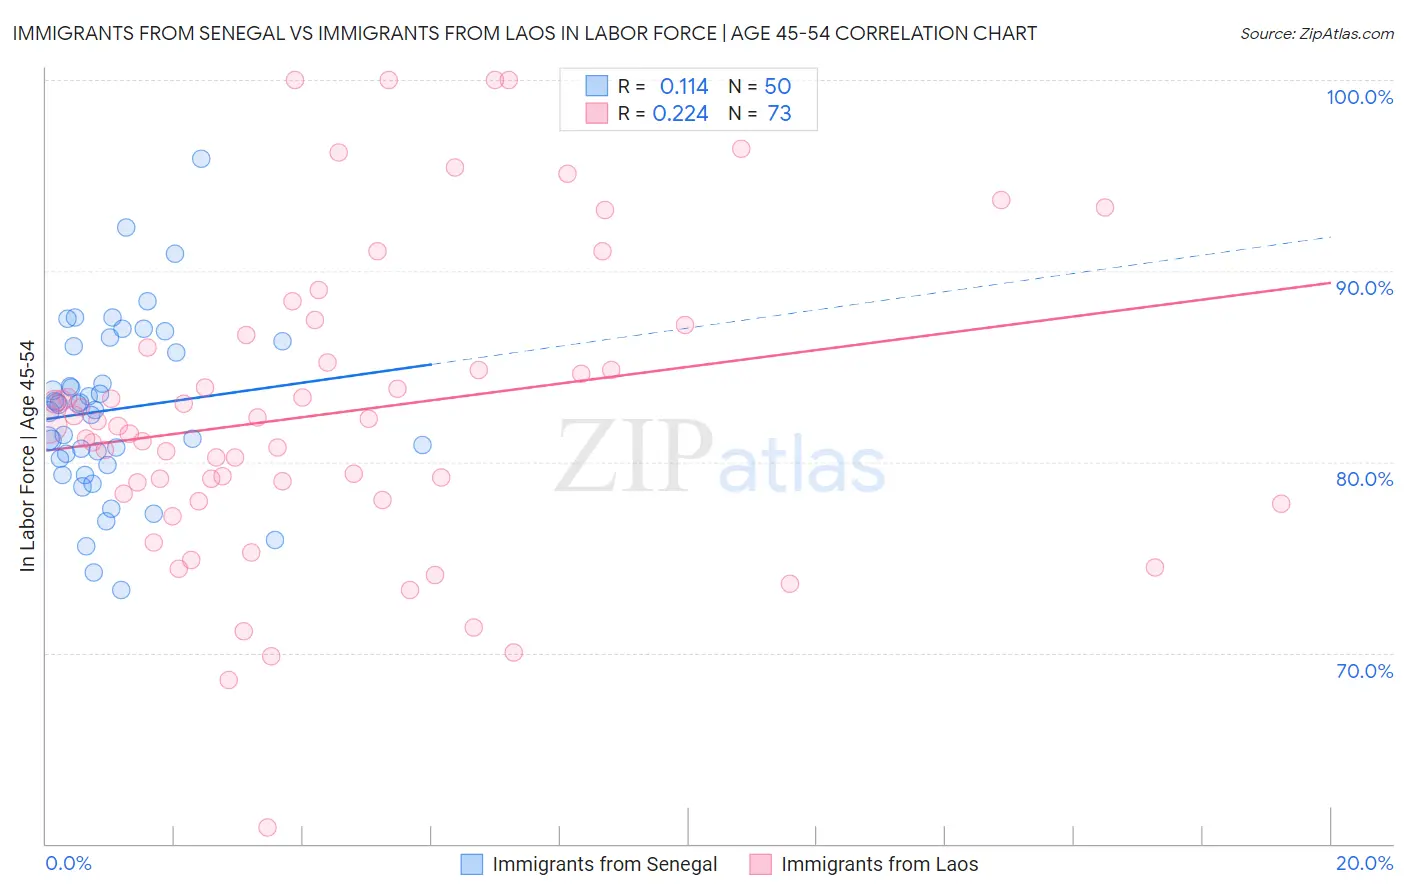
Immigrants from Senegal vs Immigrants from Laos In Labor Force | Age 45-54 Correlation Chart
The statistical analysis conducted on geographies consisting of 90,120,202 people shows a poor positive correlation between the proportion of Immigrants from Senegal and labor force participation rate among population between the ages 45 and 54 in the United States with a correlation coefficient (R) of 0.114 and weighted average of 82.0%. Similarly, the statistical analysis conducted on geographies consisting of 201,465,424 people shows a weak positive correlation between the proportion of Immigrants from Laos and labor force participation rate among population between the ages 45 and 54 in the United States with a correlation coefficient (R) of 0.224 and weighted average of 81.6%, a difference of 0.51%.
In Labor Force | Age 45-54 Correlation Summary
| Measurement | Immigrants from Senegal | Immigrants from Laos |
| Minimum | 73.3% | 60.9% |
| Maximum | 95.9% | 100.0% |
| Range | 22.6% | 39.1% |
| Mean | 82.7% | 82.6% |
| Median | 82.9% | 81.9% |
| Interquartile 25% (IQ1) | 80.2% | 78.2% |
| Interquartile 75% (IQ3) | 86.1% | 86.3% |
| Interquartile Range (IQR) | 5.9% | 8.2% |
| Standard Deviation (Sample) | 4.5% | 8.0% |
| Standard Deviation (Population) | 4.5% | 7.9% |
Similar Demographics by In Labor Force | Age 45-54
Demographics Similar to Immigrants from Senegal by In Labor Force | Age 45-54
In terms of in labor force | age 45-54, the demographic groups most similar to Immigrants from Senegal are Immigrants from Portugal (82.0%, a difference of 0.0%), Jamaican (82.0%, a difference of 0.010%), Malaysian (82.0%, a difference of 0.010%), Salvadoran (82.0%, a difference of 0.010%), and Immigrants from Burma/Myanmar (82.0%, a difference of 0.030%).
| Demographics | Rating | Rank | In Labor Force | Age 45-54 |
| Immigrants | Jamaica | 2.7 /100 | #224 | Tragic 82.1% |
| Immigrants | Oceania | 2.5 /100 | #225 | Tragic 82.1% |
| Immigrants | Caribbean | 2.5 /100 | #226 | Tragic 82.1% |
| Immigrants | Germany | 2.4 /100 | #227 | Tragic 82.1% |
| Cape Verdeans | 2.1 /100 | #228 | Tragic 82.1% |
| Immigrants | Burma/Myanmar | 1.9 /100 | #229 | Tragic 82.0% |
| Jamaicans | 1.8 /100 | #230 | Tragic 82.0% |
| Immigrants | Senegal | 1.7 /100 | #231 | Tragic 82.0% |
| Immigrants | Portugal | 1.7 /100 | #232 | Tragic 82.0% |
| Malaysians | 1.7 /100 | #233 | Tragic 82.0% |
| Salvadorans | 1.7 /100 | #234 | Tragic 82.0% |
| Sub-Saharan Africans | 1.2 /100 | #235 | Tragic 82.0% |
| Basques | 1.2 /100 | #236 | Tragic 82.0% |
| Immigrants | Trinidad and Tobago | 1.2 /100 | #237 | Tragic 82.0% |
| Trinidadians and Tobagonians | 1.1 /100 | #238 | Tragic 81.9% |
Demographics Similar to Immigrants from Laos by In Labor Force | Age 45-54
In terms of in labor force | age 45-54, the demographic groups most similar to Immigrants from Laos are Japanese (81.6%, a difference of 0.010%), Scotch-Irish (81.6%, a difference of 0.020%), Pennsylvania German (81.6%, a difference of 0.030%), Barbadian (81.6%, a difference of 0.040%), and Guamanian/Chamorro (81.6%, a difference of 0.050%).
| Demographics | Rating | Rank | In Labor Force | Age 45-54 |
| Central Americans | 0.4 /100 | #247 | Tragic 81.7% |
| Puget Sound Salish | 0.3 /100 | #248 | Tragic 81.7% |
| Hmong | 0.3 /100 | #249 | Tragic 81.7% |
| Immigrants | Armenia | 0.2 /100 | #250 | Tragic 81.7% |
| Guamanians/Chamorros | 0.2 /100 | #251 | Tragic 81.6% |
| Pennsylvania Germans | 0.2 /100 | #252 | Tragic 81.6% |
| Japanese | 0.2 /100 | #253 | Tragic 81.6% |
| Immigrants | Laos | 0.2 /100 | #254 | Tragic 81.6% |
| Scotch-Irish | 0.2 /100 | #255 | Tragic 81.6% |
| Barbadians | 0.1 /100 | #256 | Tragic 81.6% |
| Immigrants | Congo | 0.1 /100 | #257 | Tragic 81.6% |
| Immigrants | Fiji | 0.1 /100 | #258 | Tragic 81.5% |
| Guyanese | 0.1 /100 | #259 | Tragic 81.5% |
| Spaniards | 0.1 /100 | #260 | Tragic 81.5% |
| Hawaiians | 0.1 /100 | #261 | Tragic 81.5% |