Immigrants from Senegal vs Immigrants from Laos Child Poverty Under the Age of 5
COMPARE
Immigrants from Senegal
Immigrants from Laos
Child Poverty Under the Age of 5
Child Poverty Under the Age of 5 Comparison
Immigrants from Senegal
Immigrants from Laos
21.3%
CHILD POVERTY UNDER THE AGE OF 5
0.0/ 100
METRIC RATING
288th/ 347
METRIC RANK
19.4%
CHILD POVERTY UNDER THE AGE OF 5
0.8/ 100
METRIC RATING
235th/ 347
METRIC RANK
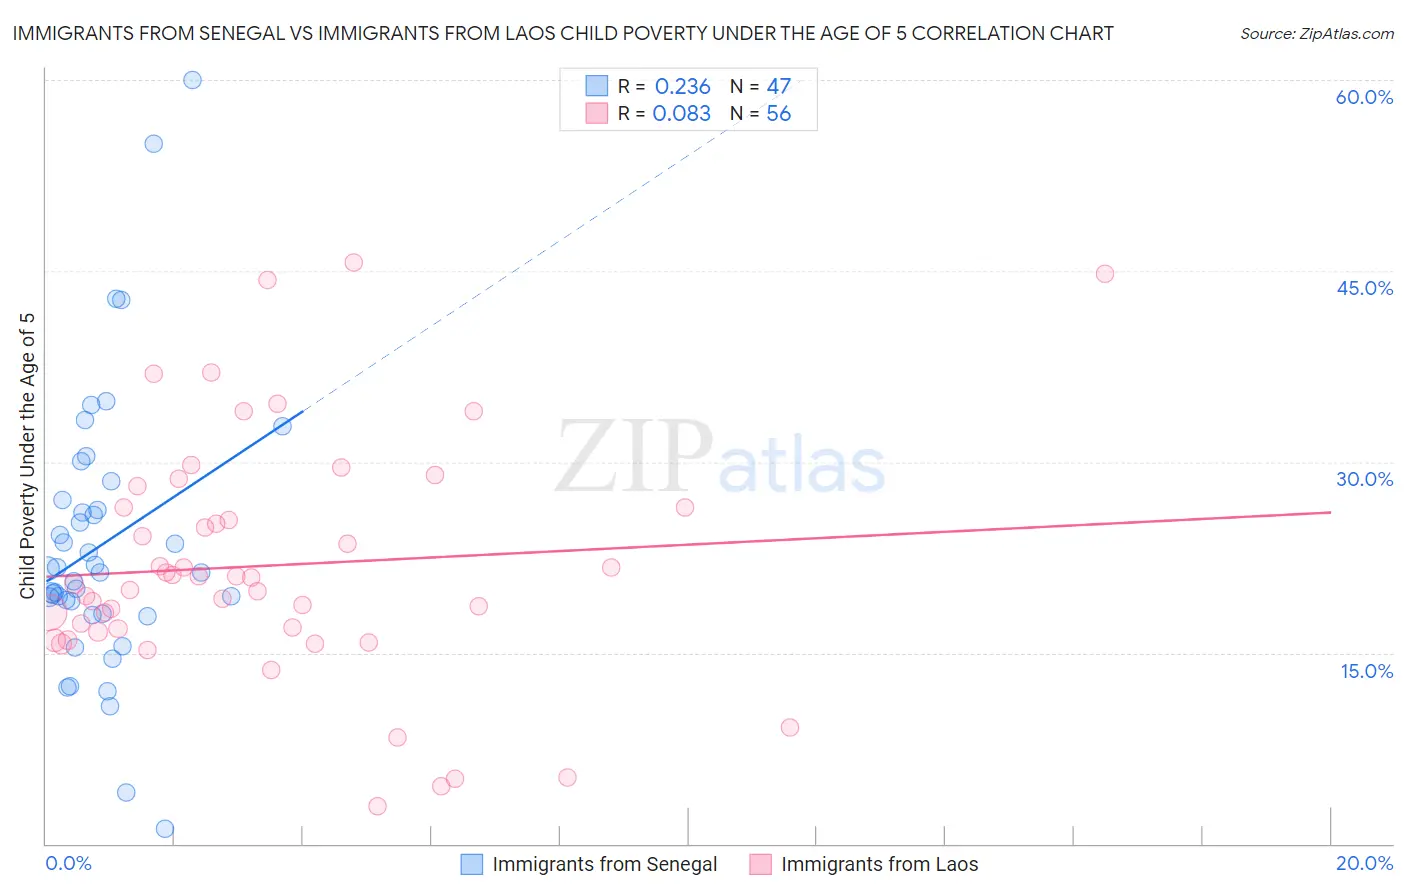
Immigrants from Senegal vs Immigrants from Laos Child Poverty Under the Age of 5 Correlation Chart
The statistical analysis conducted on geographies consisting of 89,495,365 people shows a weak positive correlation between the proportion of Immigrants from Senegal and poverty level among children under the age of 5 in the United States with a correlation coefficient (R) of 0.236 and weighted average of 21.3%. Similarly, the statistical analysis conducted on geographies consisting of 197,804,154 people shows a slight positive correlation between the proportion of Immigrants from Laos and poverty level among children under the age of 5 in the United States with a correlation coefficient (R) of 0.083 and weighted average of 19.4%, a difference of 9.7%.
Child Poverty Under the Age of 5 Correlation Summary
| Measurement | Immigrants from Senegal | Immigrants from Laos |
| Minimum | 1.2% | 2.9% |
| Maximum | 60.0% | 45.7% |
| Range | 58.8% | 42.8% |
| Mean | 23.5% | 21.9% |
| Median | 21.4% | 20.7% |
| Interquartile 25% (IQ1) | 18.1% | 16.8% |
| Interquartile 75% (IQ3) | 27.0% | 26.4% |
| Interquartile Range (IQR) | 8.9% | 9.7% |
| Standard Deviation (Sample) | 11.0% | 9.4% |
| Standard Deviation (Population) | 10.9% | 9.3% |
Similar Demographics by Child Poverty Under the Age of 5
Demographics Similar to Immigrants from Senegal by Child Poverty Under the Age of 5
In terms of child poverty under the age of 5, the demographic groups most similar to Immigrants from Senegal are Immigrants from Haiti (21.3%, a difference of 0.070%), Immigrants from Zaire (21.3%, a difference of 0.17%), Immigrants from Latin America (21.2%, a difference of 0.27%), Haitian (21.2%, a difference of 0.34%), and Immigrants from Caribbean (21.4%, a difference of 0.48%).
| Demographics | Rating | Rank | Child Poverty Under the Age of 5 |
| Senegalese | 0.0 /100 | #281 | Tragic 20.9% |
| Potawatomi | 0.0 /100 | #282 | Tragic 21.0% |
| Comanche | 0.0 /100 | #283 | Tragic 21.0% |
| Somalis | 0.0 /100 | #284 | Tragic 21.1% |
| Haitians | 0.0 /100 | #285 | Tragic 21.2% |
| Immigrants | Latin America | 0.0 /100 | #286 | Tragic 21.2% |
| Immigrants | Zaire | 0.0 /100 | #287 | Tragic 21.3% |
| Immigrants | Senegal | 0.0 /100 | #288 | Tragic 21.3% |
| Immigrants | Haiti | 0.0 /100 | #289 | Tragic 21.3% |
| Immigrants | Caribbean | 0.0 /100 | #290 | Tragic 21.4% |
| British West Indians | 0.0 /100 | #291 | Tragic 21.4% |
| Immigrants | Somalia | 0.0 /100 | #292 | Tragic 21.6% |
| Mexicans | 0.0 /100 | #293 | Tragic 21.6% |
| Guatemalans | 0.0 /100 | #294 | Tragic 21.6% |
| Cherokee | 0.0 /100 | #295 | Tragic 21.7% |
Demographics Similar to Immigrants from Laos by Child Poverty Under the Age of 5
In terms of child poverty under the age of 5, the demographic groups most similar to Immigrants from Laos are Immigrants from Trinidad and Tobago (19.4%, a difference of 0.0%), Immigrants from Micronesia (19.4%, a difference of 0.21%), Sudanese (19.3%, a difference of 0.33%), Trinidadian and Tobagonian (19.3%, a difference of 0.39%), and Immigrants from Cabo Verde (19.5%, a difference of 0.56%).
| Demographics | Rating | Rank | Child Poverty Under the Age of 5 |
| Immigrants | Sudan | 1.3 /100 | #228 | Tragic 19.2% |
| Ghanaians | 1.2 /100 | #229 | Tragic 19.2% |
| Ecuadorians | 1.2 /100 | #230 | Tragic 19.2% |
| Bermudans | 1.2 /100 | #231 | Tragic 19.2% |
| Trinidadians and Tobagonians | 0.9 /100 | #232 | Tragic 19.3% |
| Sudanese | 0.9 /100 | #233 | Tragic 19.3% |
| Immigrants | Micronesia | 0.9 /100 | #234 | Tragic 19.4% |
| Immigrants | Laos | 0.8 /100 | #235 | Tragic 19.4% |
| Immigrants | Trinidad and Tobago | 0.8 /100 | #236 | Tragic 19.4% |
| Immigrants | Cabo Verde | 0.6 /100 | #237 | Tragic 19.5% |
| Salvadorans | 0.6 /100 | #238 | Tragic 19.5% |
| Vietnamese | 0.6 /100 | #239 | Tragic 19.5% |
| Immigrants | Ecuador | 0.5 /100 | #240 | Tragic 19.6% |
| Alaska Natives | 0.5 /100 | #241 | Tragic 19.6% |
| Immigrants | Guyana | 0.5 /100 | #242 | Tragic 19.6% |